MGnify is EMBL-EBI’s metagenomics resource. MGnify’s recently launched Notebook Server provides an online Jupyter Lab environment for users to explore programmatic access to MGnify’s datasets using Python or R. Here, we report several developments to the Notebook Server completed during the BioHackathon Europe 2022. The developments range from establishing an instance of the notebooks on the Galaxy platform, to adding new notebooks and Jupyter UI extensions enabling more users to perform downstream analysis tasks on MGnify’s extensive metagenomics datasets.

Figures
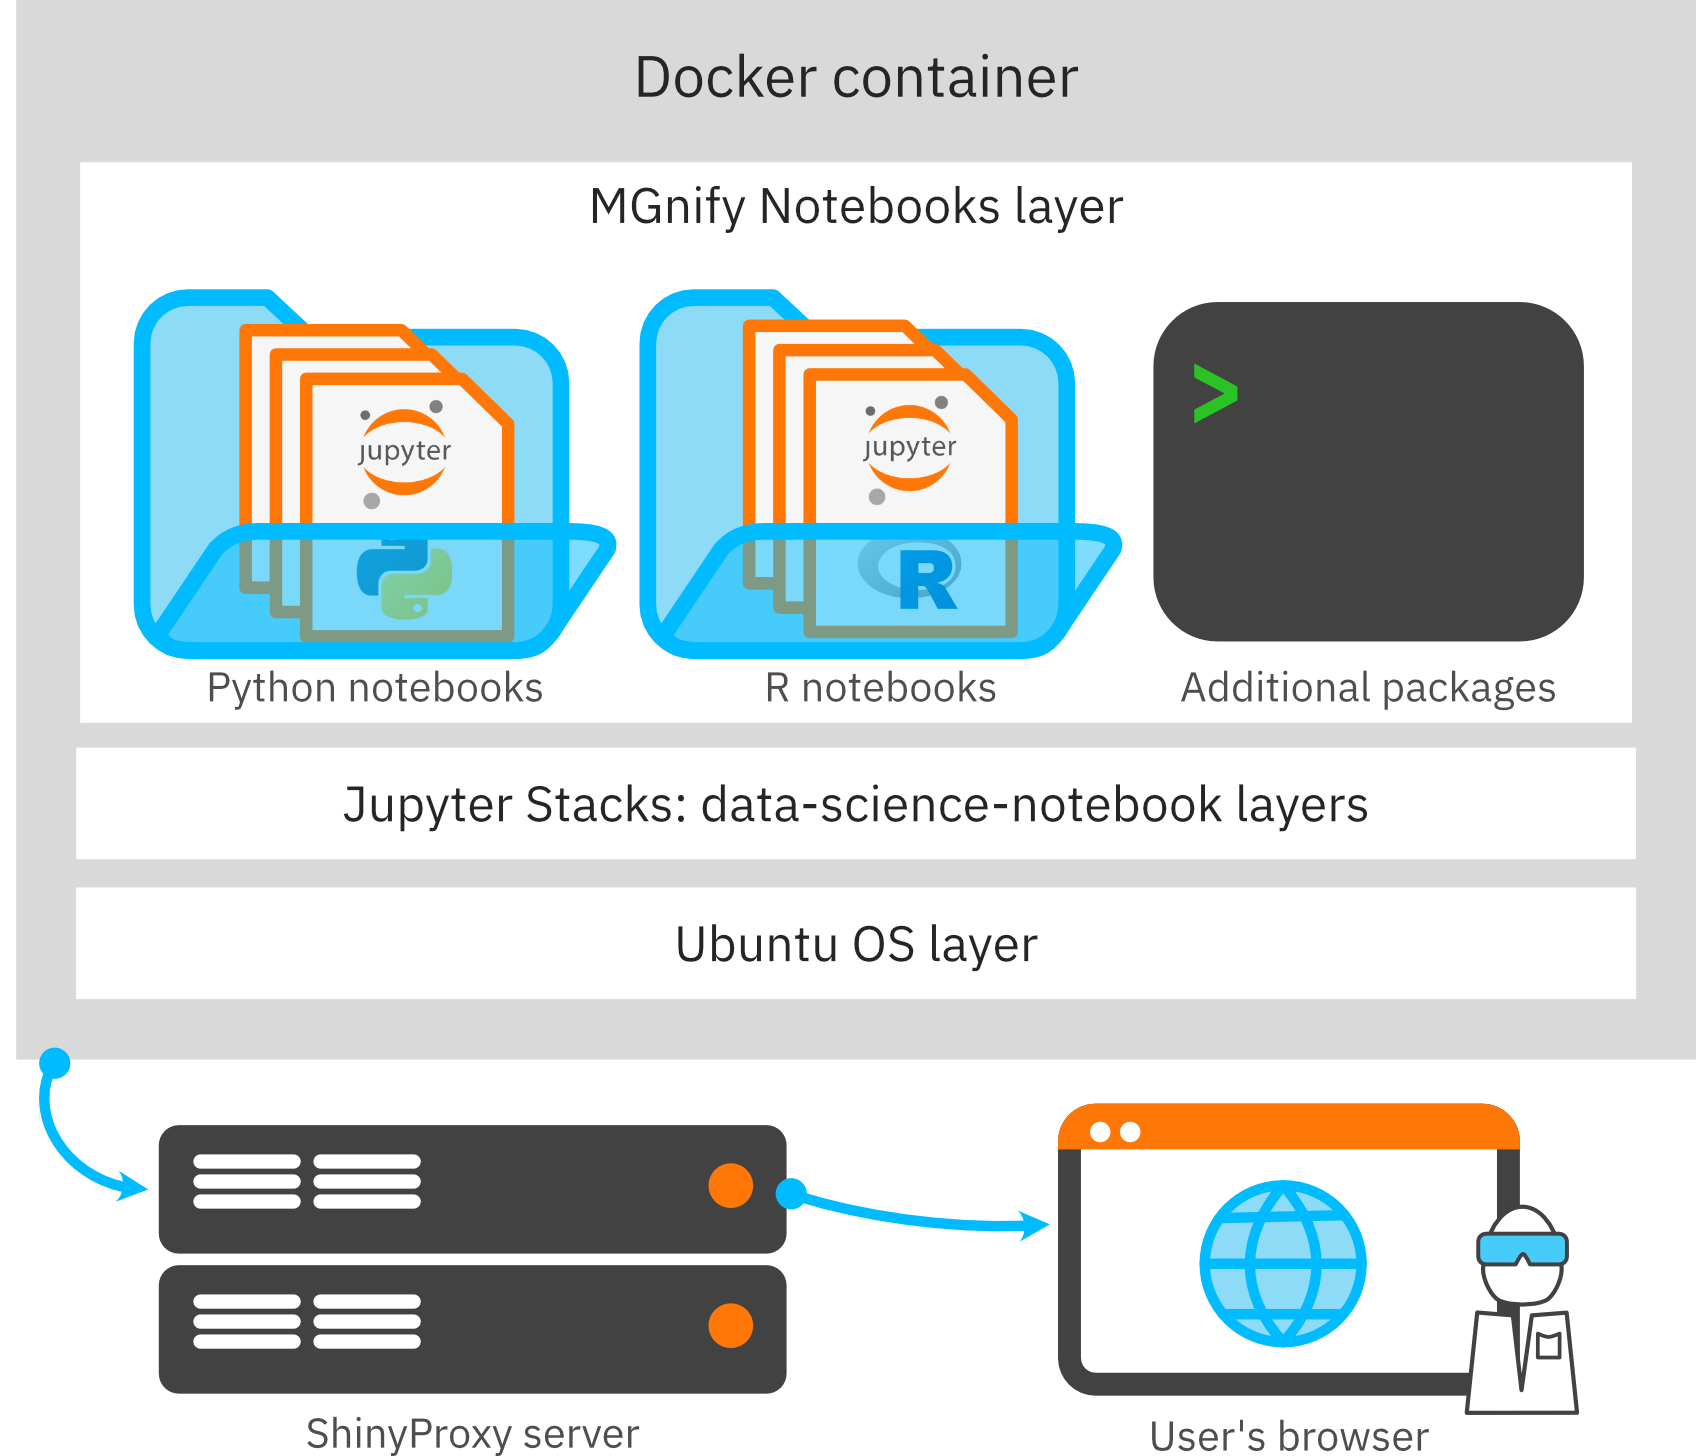
Schematic of the Notebook Server technology stack. Other configurations (e.g. different servers or Docker base layers) are...
Schematic of the Notebook Server technology stack. Other configurations (e.g. different servers or Docker base layers) are also possible.
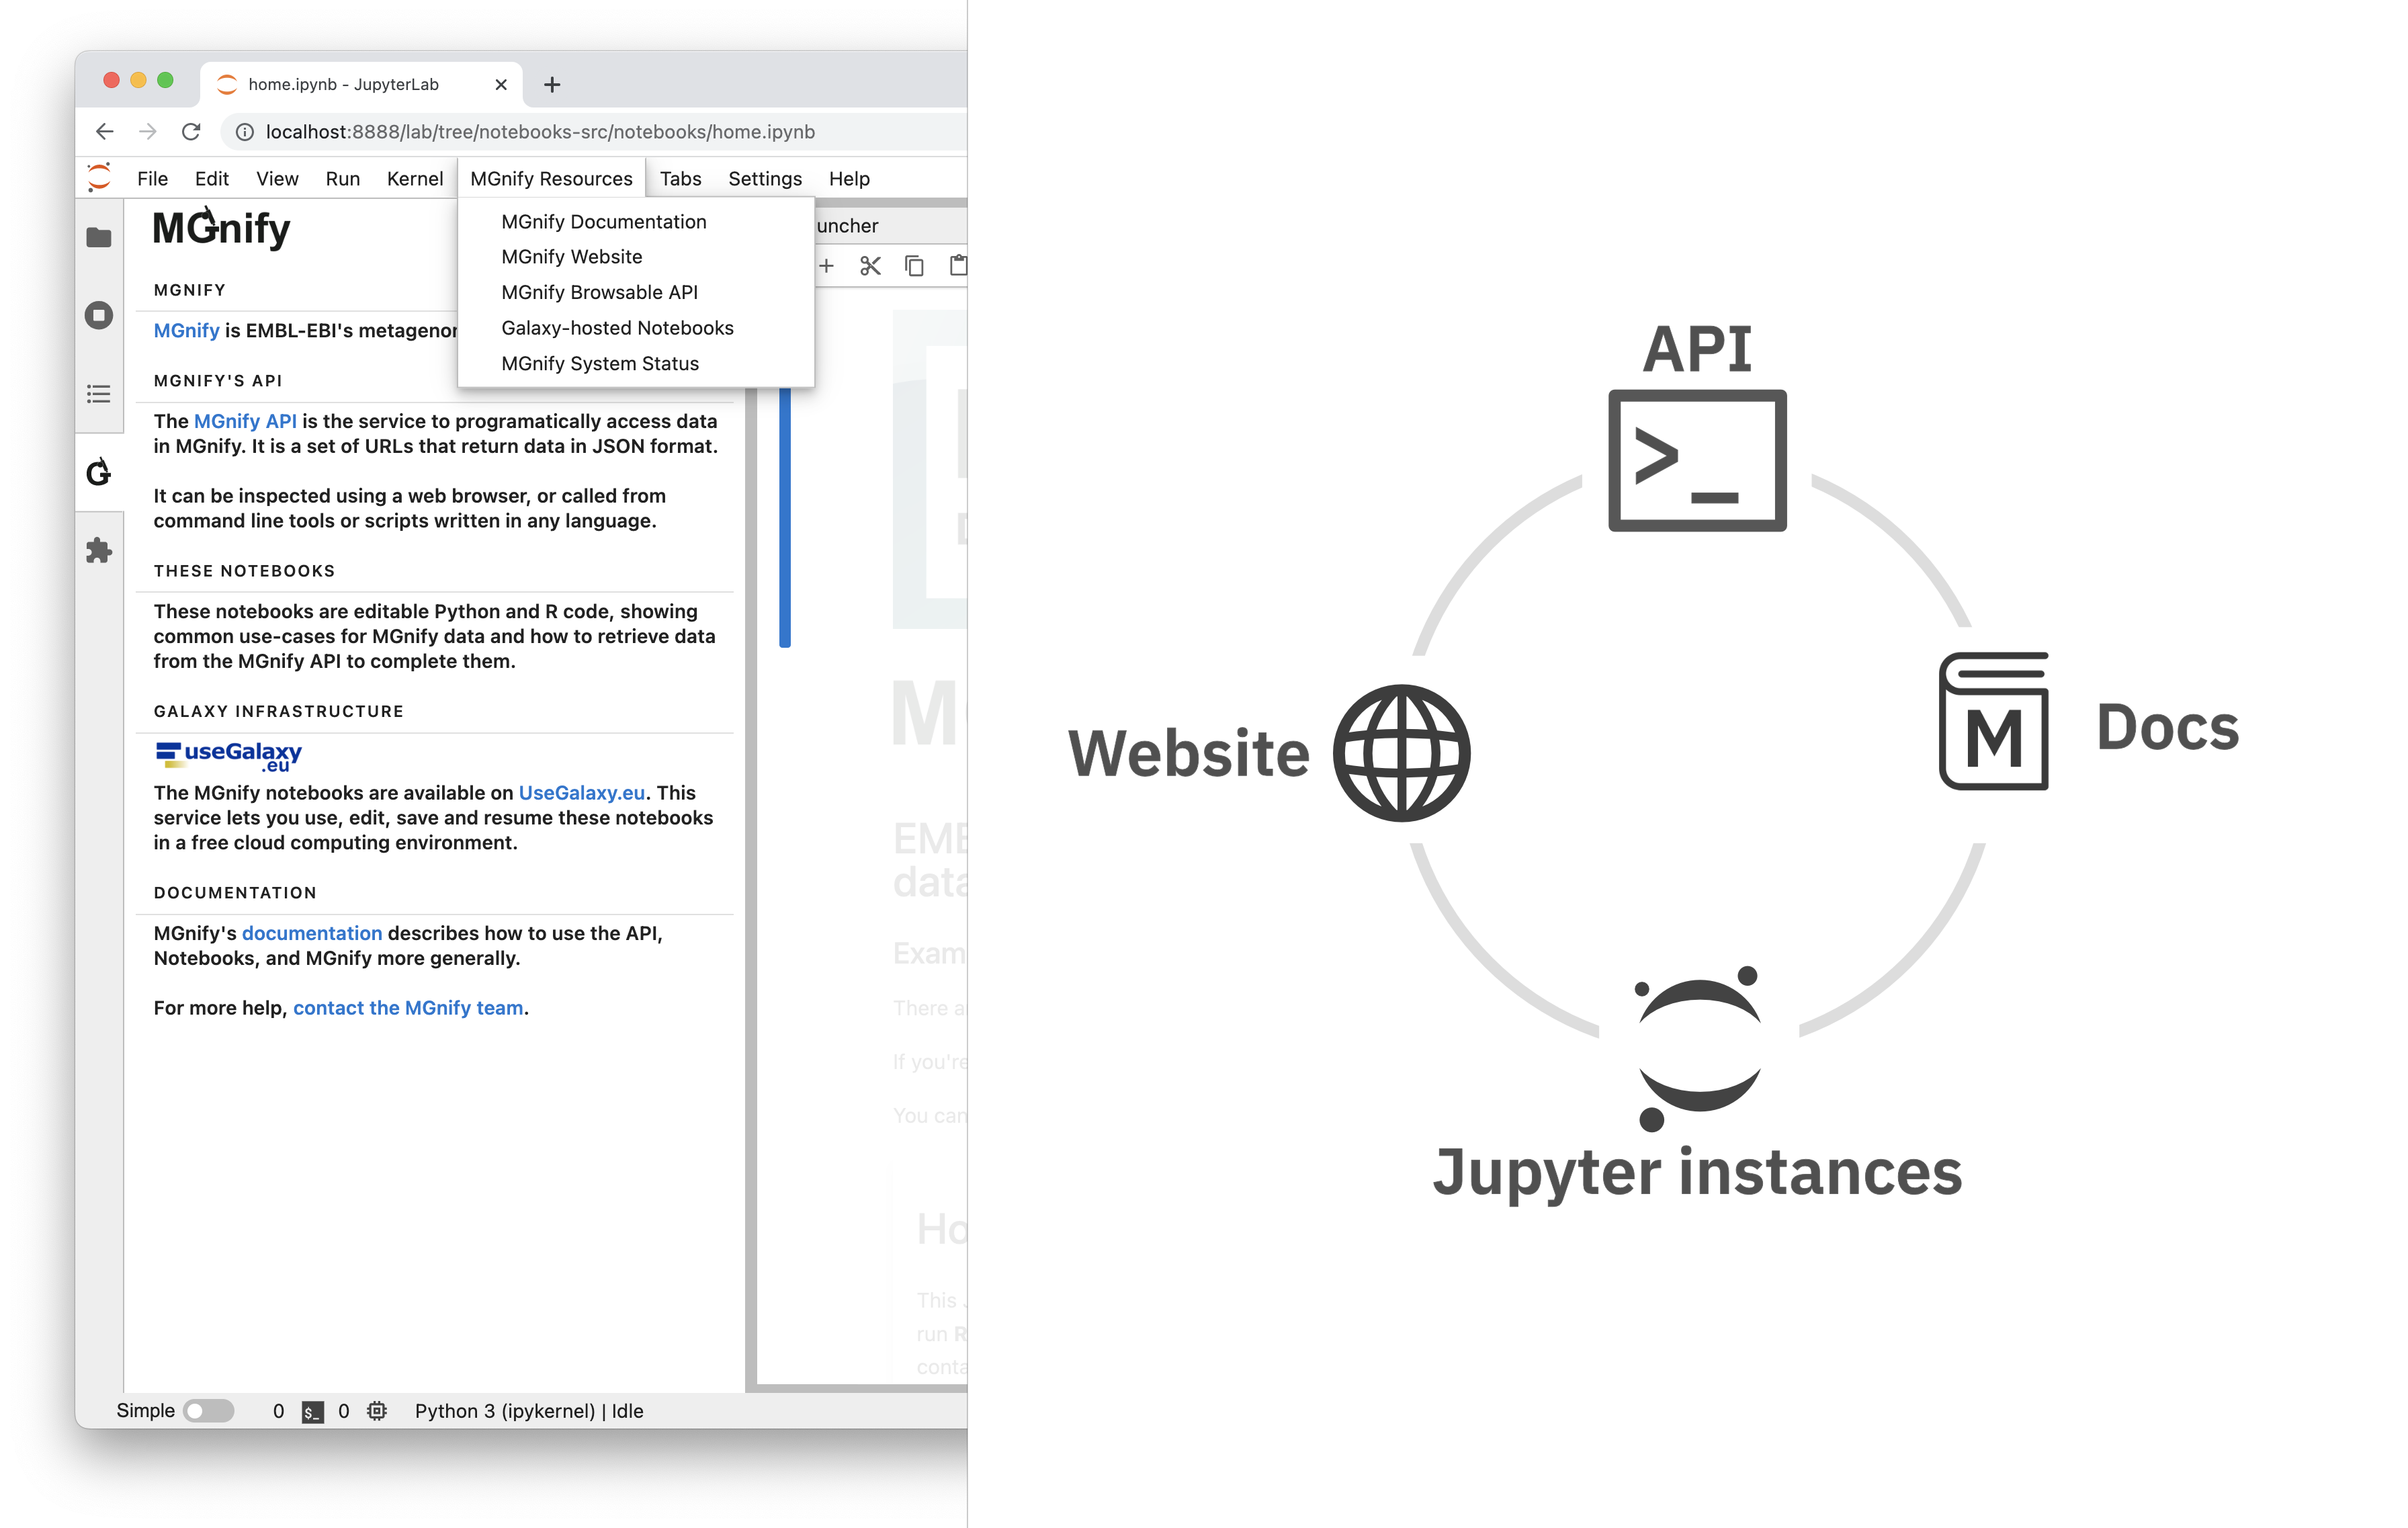
MGnify-specific guidance is provided in a Jupyter Lab user interface extension.
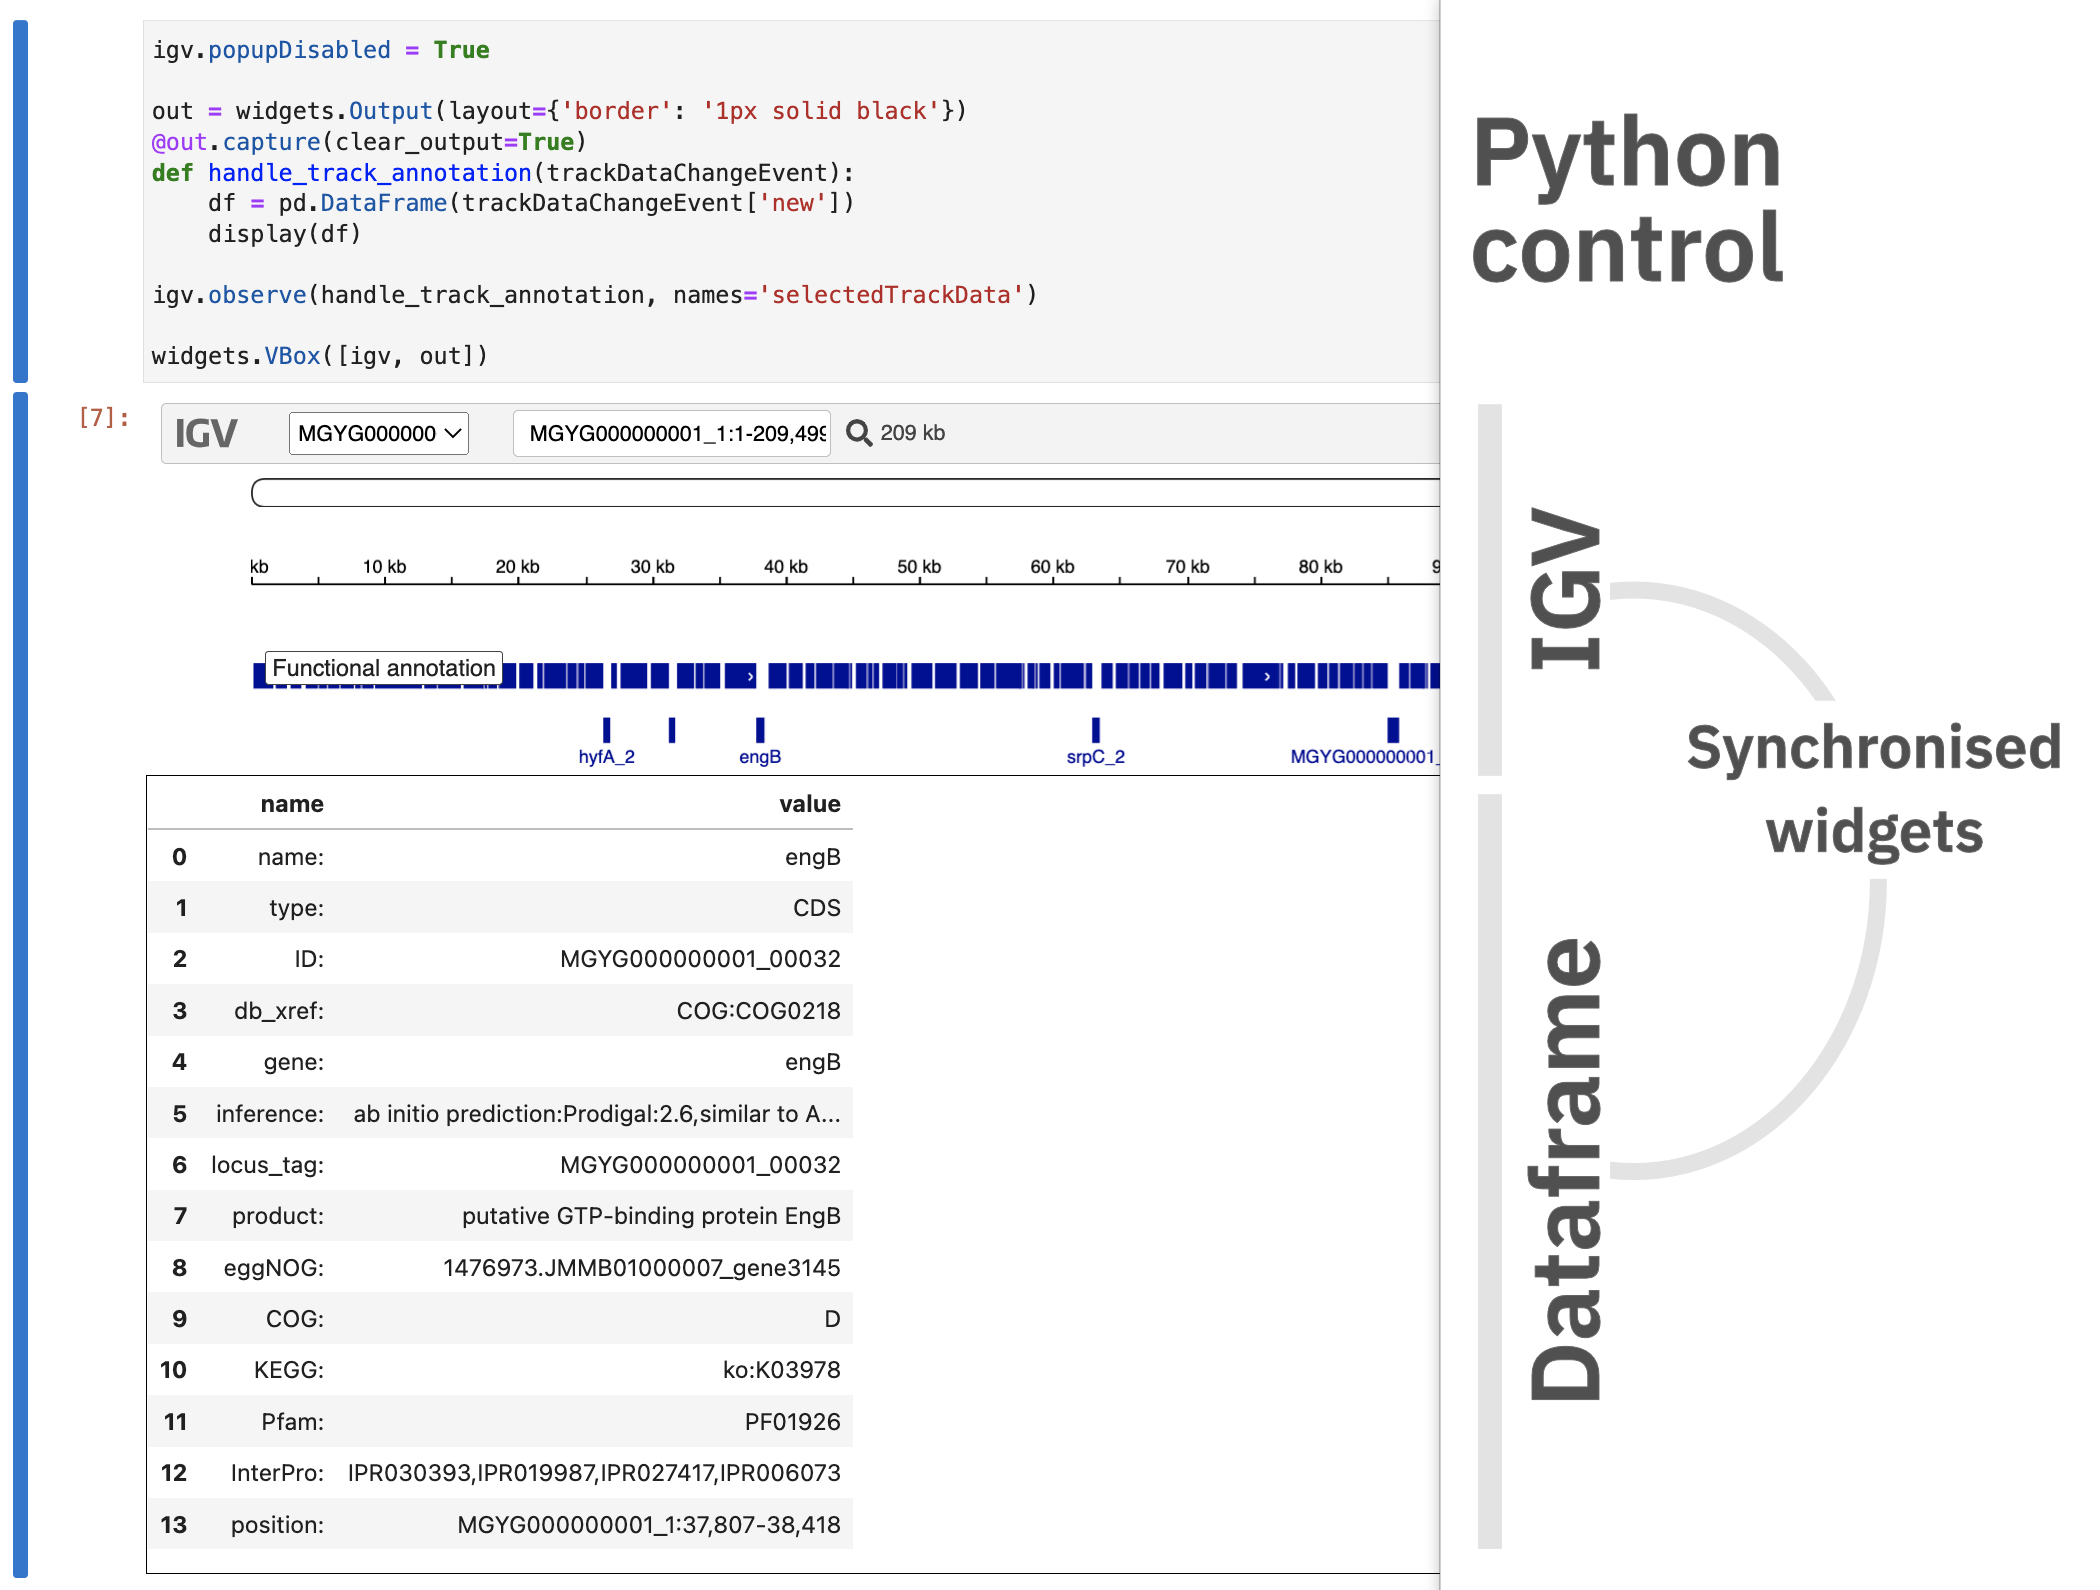
An IGV.js instance used as an interactive Jupyter Lab widget. Clicking a region on the “Functional annotation” track runs ...
An IGV.js instance used as an interactive Jupyter Lab widget. Clicking a region on the “Functional annotation” track ...An IGV.js instance used as an interactive Jupyter Lab widget. Clicking a region on the “Functional annotation” track runs the handle_track_annotation method, rendering the dataframe shown below IGV.
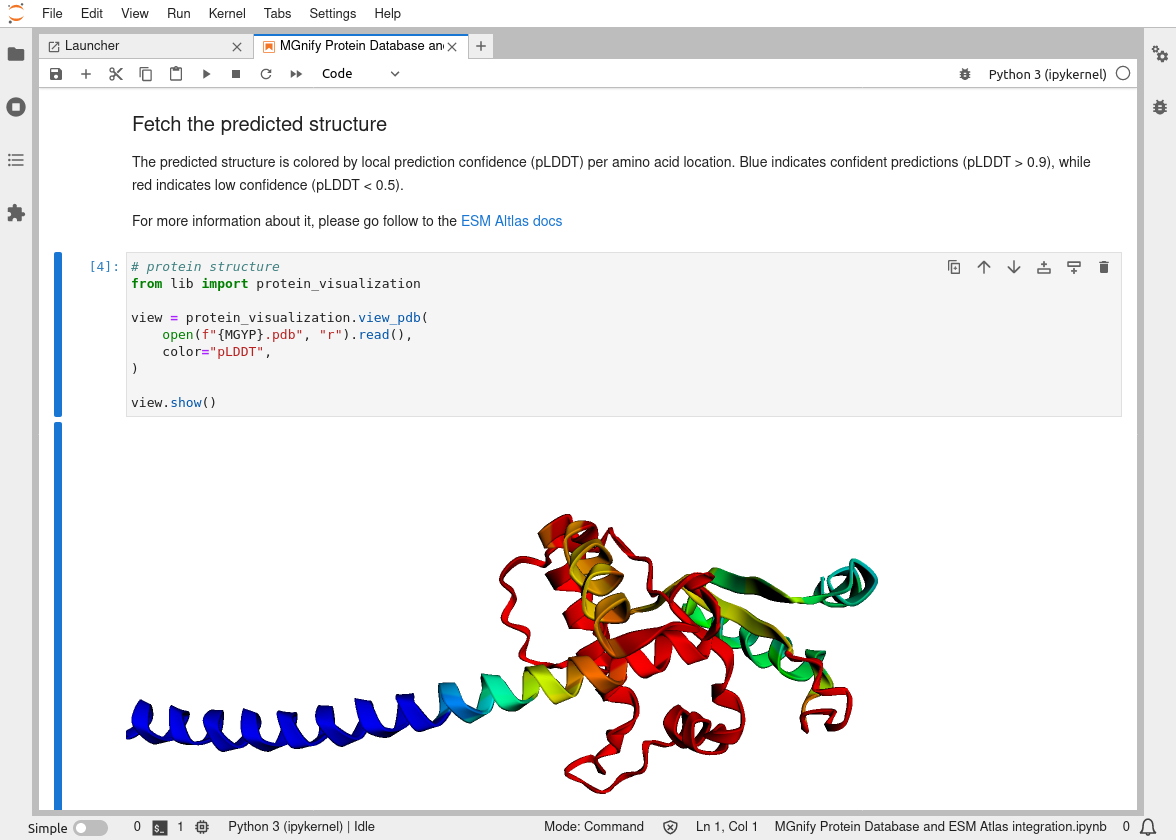
Notebook and API developed for the MGnify protein database
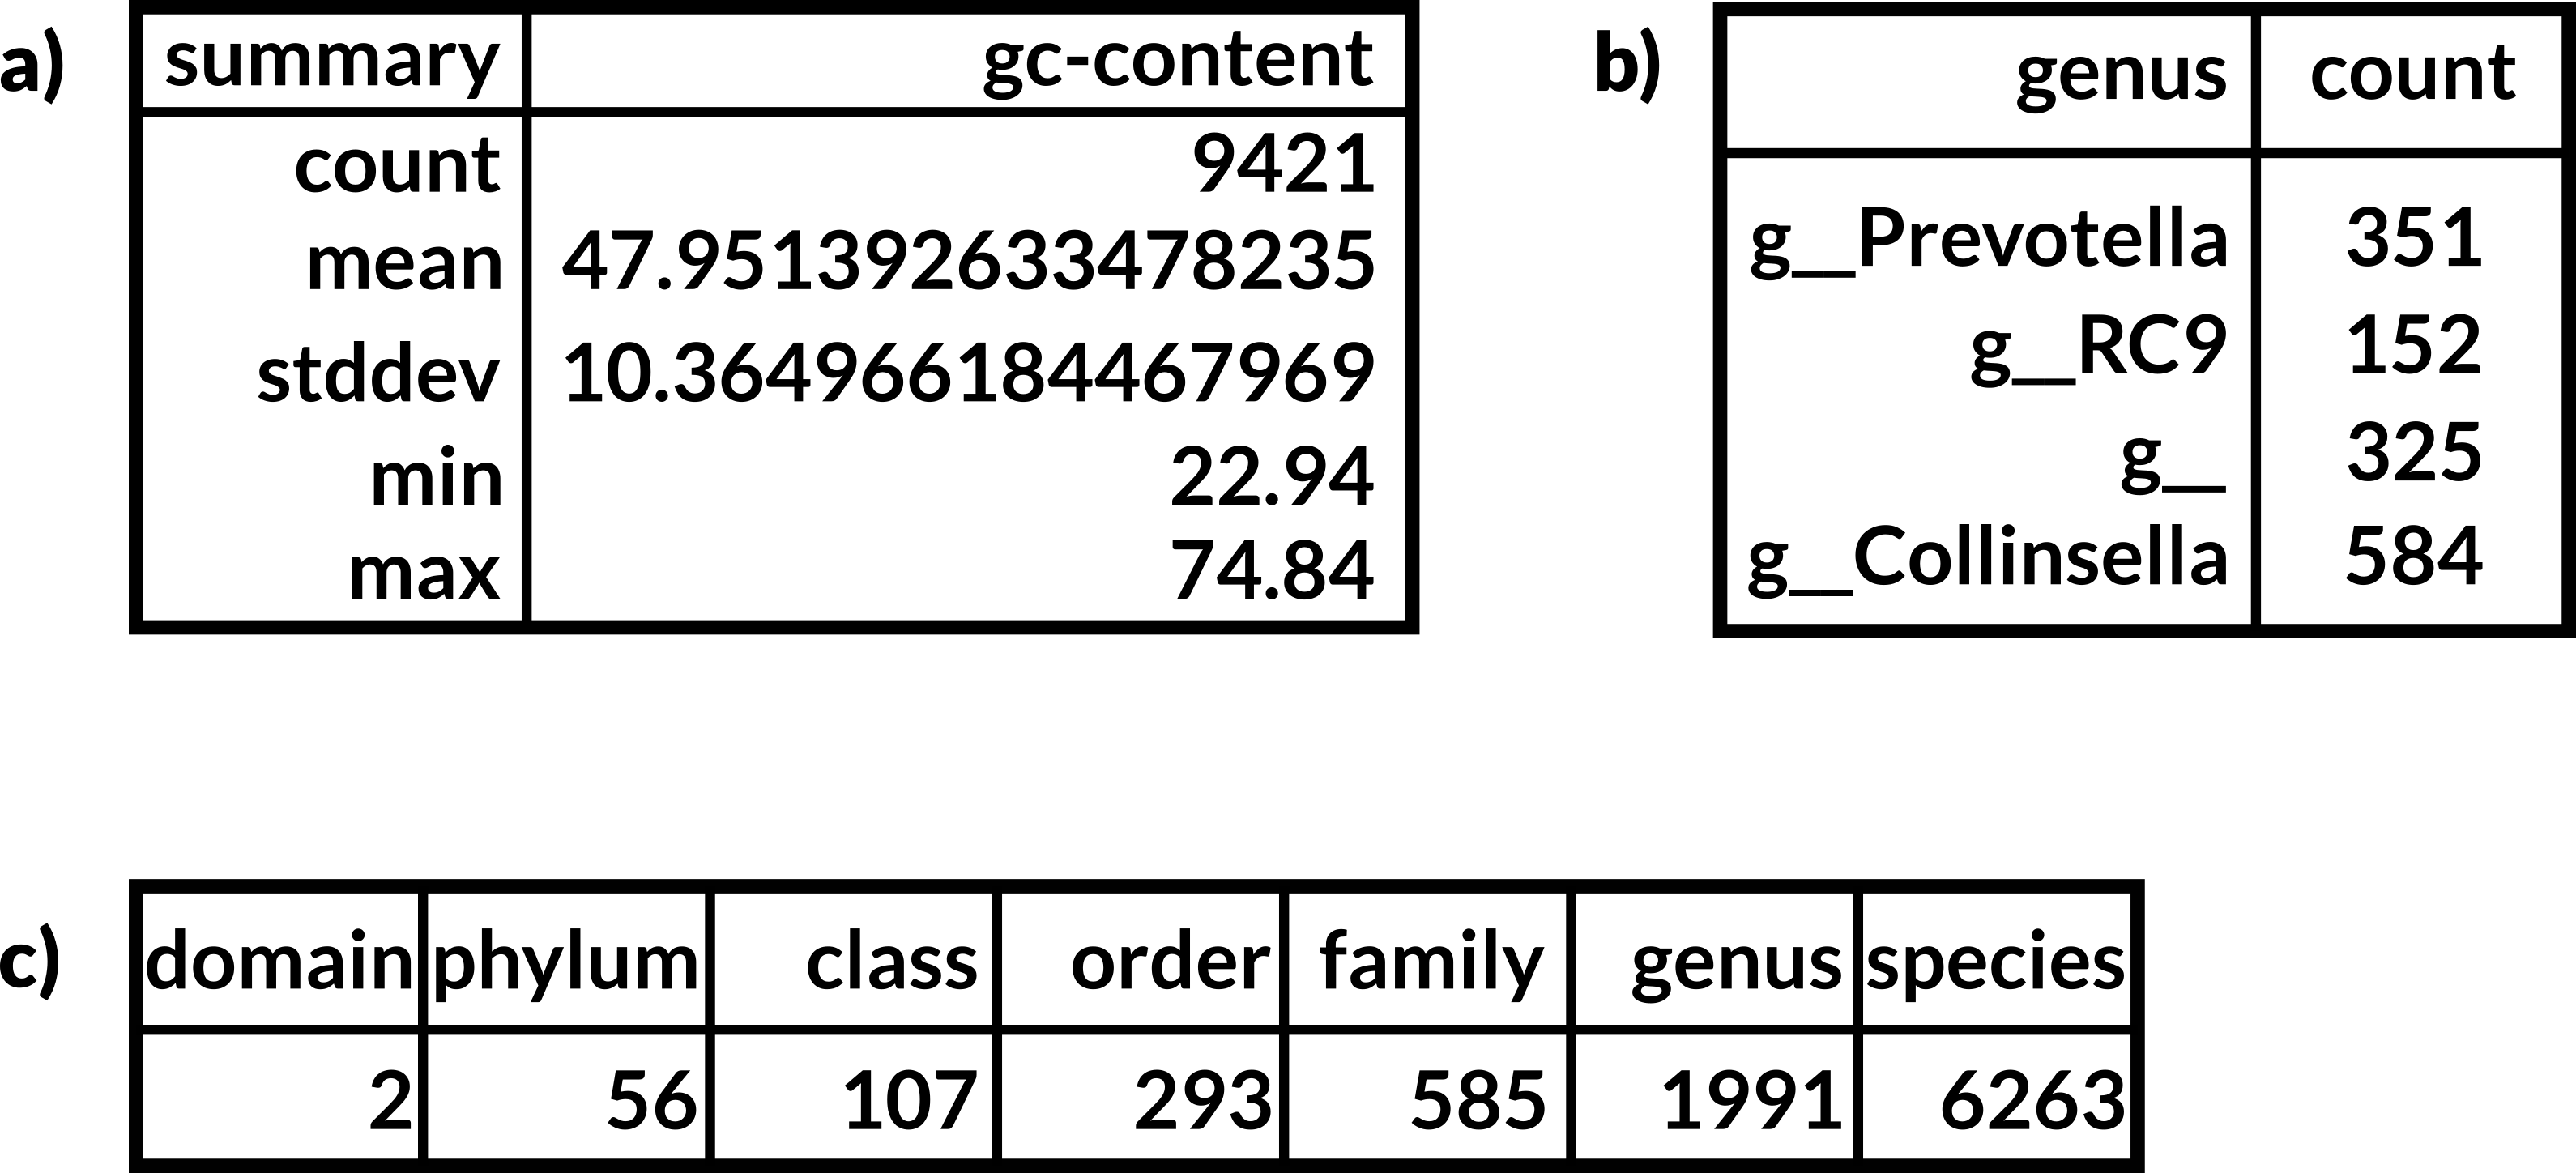
Genome dataset exploration sample: a) Whole dataset gc-content statistics; b) Most represented genuses in the dataset; c) ...
Genome dataset exploration sample: a) Whole dataset gc-content statistics; b) Most represented genuses in the dataset...Genome dataset exploration sample: a) Whole dataset gc-content statistics; b) Most represented genuses in the dataset; c) Genome count per taxonomic rank.
Sample of plots: a) Genomes in our dataset corresponding to bacteria from the Lactobacillales order; b) Number of genomes ...
Sample of plots: a) Genomes in our dataset corresponding to bacteria from the Lactobacillales order; b) Number of gen...Sample of plots: a) Genomes in our dataset corresponding to bacteria from the Lactobacillales order; b) Number of genomes avalaible, genome length and GC-content of bacteria belonging the Lactobacillales order; c) Biome and Catalogue related to bacteria belonging the Lactobacillales order.
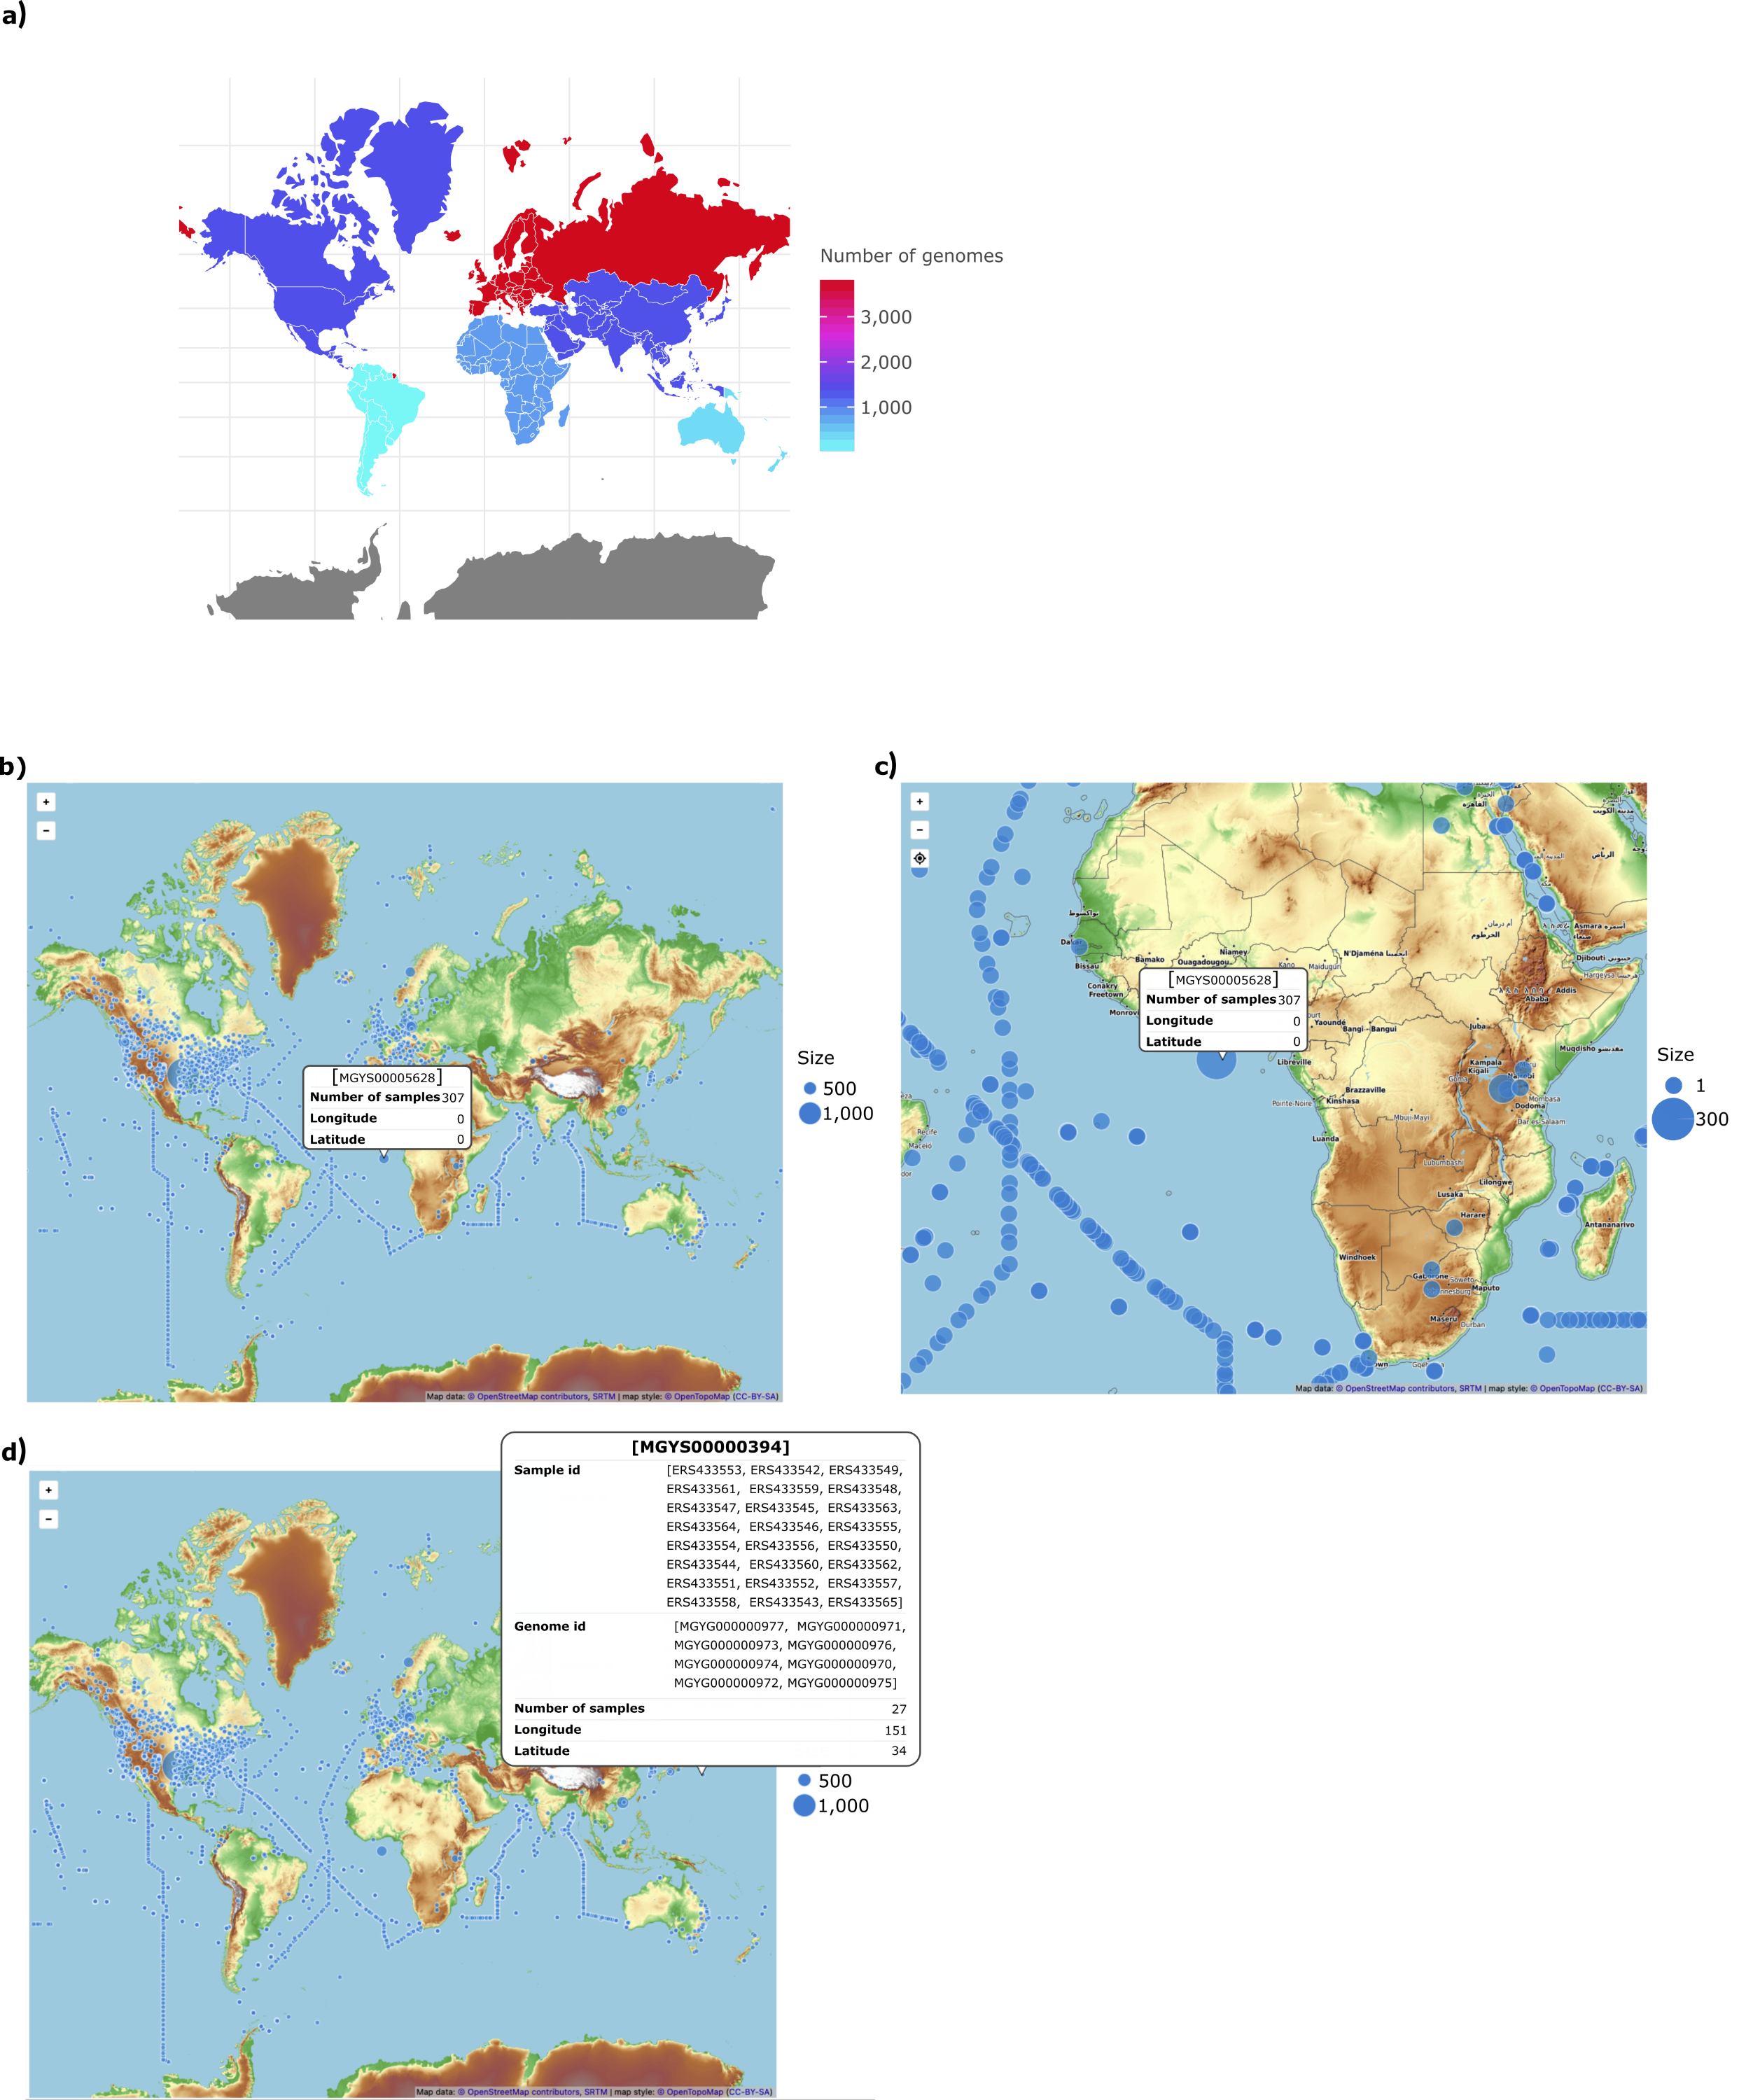
Map examples: a) Interactive map representing the number of genomes according to their geographical origin. Hovering conti...
Map examples: a) Interactive map representing the number of genomes according to their geographical origin. Hovering ...Map examples: a) Interactive map representing the number of genomes according to their geographical origin. Hovering continents with the mouse curser allows to see the exact count per continent. b) Interactive map representing the localisation of the samples. Each blue dots represents the proportion of samples for a given longitude-latitude set. c) Zoom in b) on a sampling region of interest. d) In addition to the number of samples and the longitude and latitude, hovering the blue dots with the mouse cursor allow the users to display additional related information such as the ID of the study, the sample IDs and the genome IDs, when available.