Genome Annotation and Other Post-Assembly Workflows for the Tree of Life
Rapid advances in genome sequencing technologies have resulted in an explosion of referencequality genome assemblies across the tree of life. While these resources will be invaluable towards goals of species and biodiversity conservation, their application is limited when they lack accurate annotations of their functional elements. The European Reference Genome Atlas (ERGA) is the European node of the Earth Biogenome Project (EBP) and aims to share resources and knowledge to create fully-annotated reference genomes. ERGA strives to do this in a distributed manner, bringing together researchers from across the world, with common goals and understandings.In the BioHackathon Europe 2023, we came together to construct and test tools, pipelines and workflows for annotating protein-coding regions in assembled genomes. We specifically aimed to evaluate (a) the performance in a wide variety of non-model organisms and (b) the “usability” of pipelines for newcomers to annotation. This work required installing and implementing tools in a number of computational environments and infrastructures, sharing of both genomic resources and expertise between researchers from a range of institutes, and evaluation of annotation workflows performance and what input data is required in order to achieve a high quality genome annotation. Here we present the results of over 20 researchers in 8 time-zones working towards a robust implementation of genome annotation workflows in eukaryotic organisms.
Figures
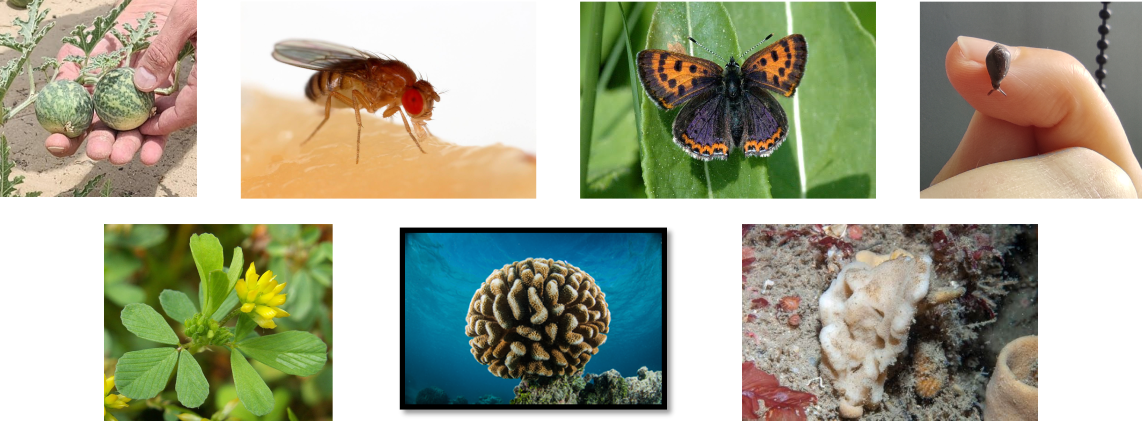
Species used to test annotation pipelines. Clockwise from top left: Citrullus colocynthis, Drosophila melanogaster, H...
Species used to test annotation pipelines. Clockwise from top left: Citrullus colocynthis, Drosophila melanogaster, Helleia helle, Melampus jaumei, Phakellia ventilabrum, Pocillopora cf. efusa and Trifolium dubium
Structure of annotation workflows tested. Shown are the input data, software and pipeline structure of the UNIL (top-...
Structure of annotation workflows tested. Shown are the input data, software and pipeline structure of the UNIL (top-left), CNAG (top-right), ANNOTATO (bottom-left) and Braker3 (bottom-right) workflows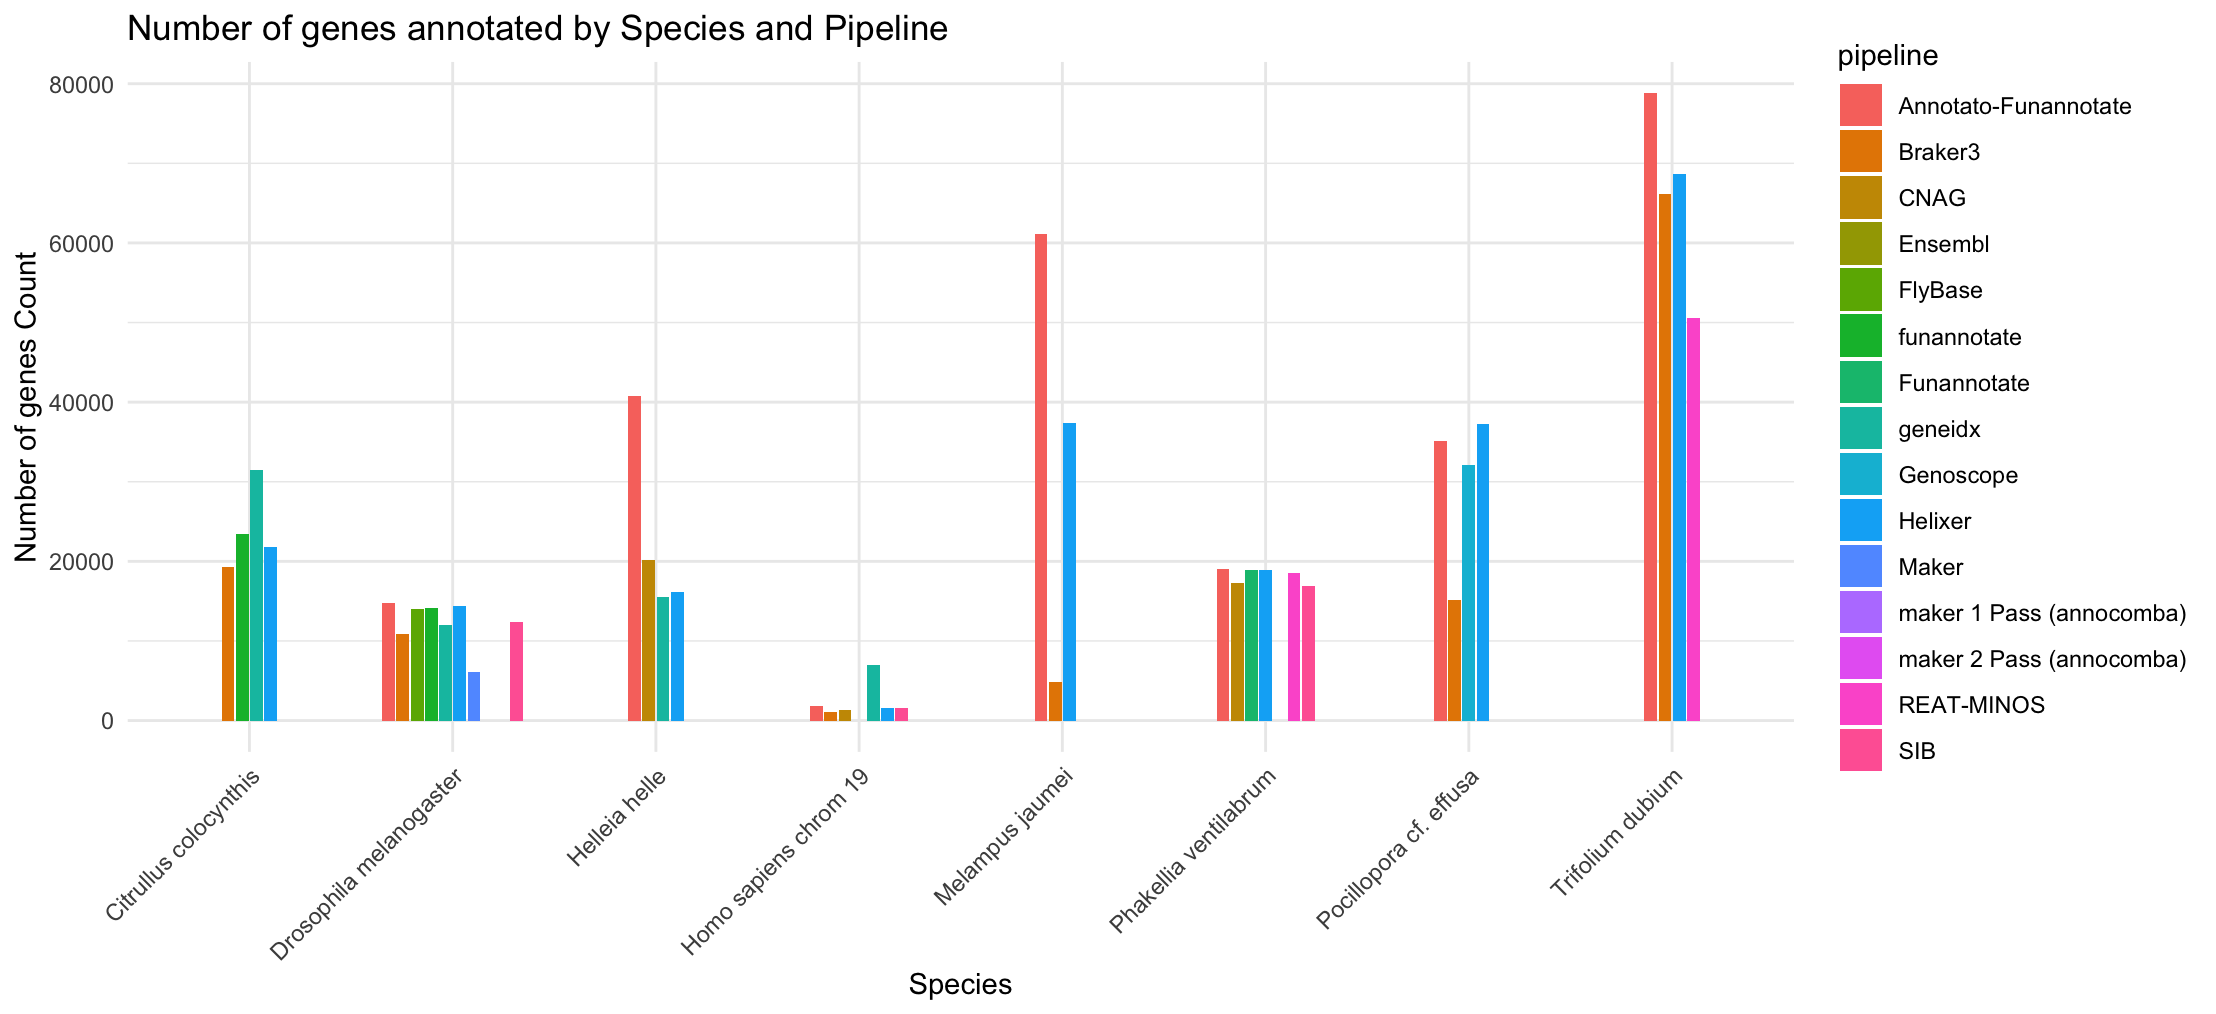
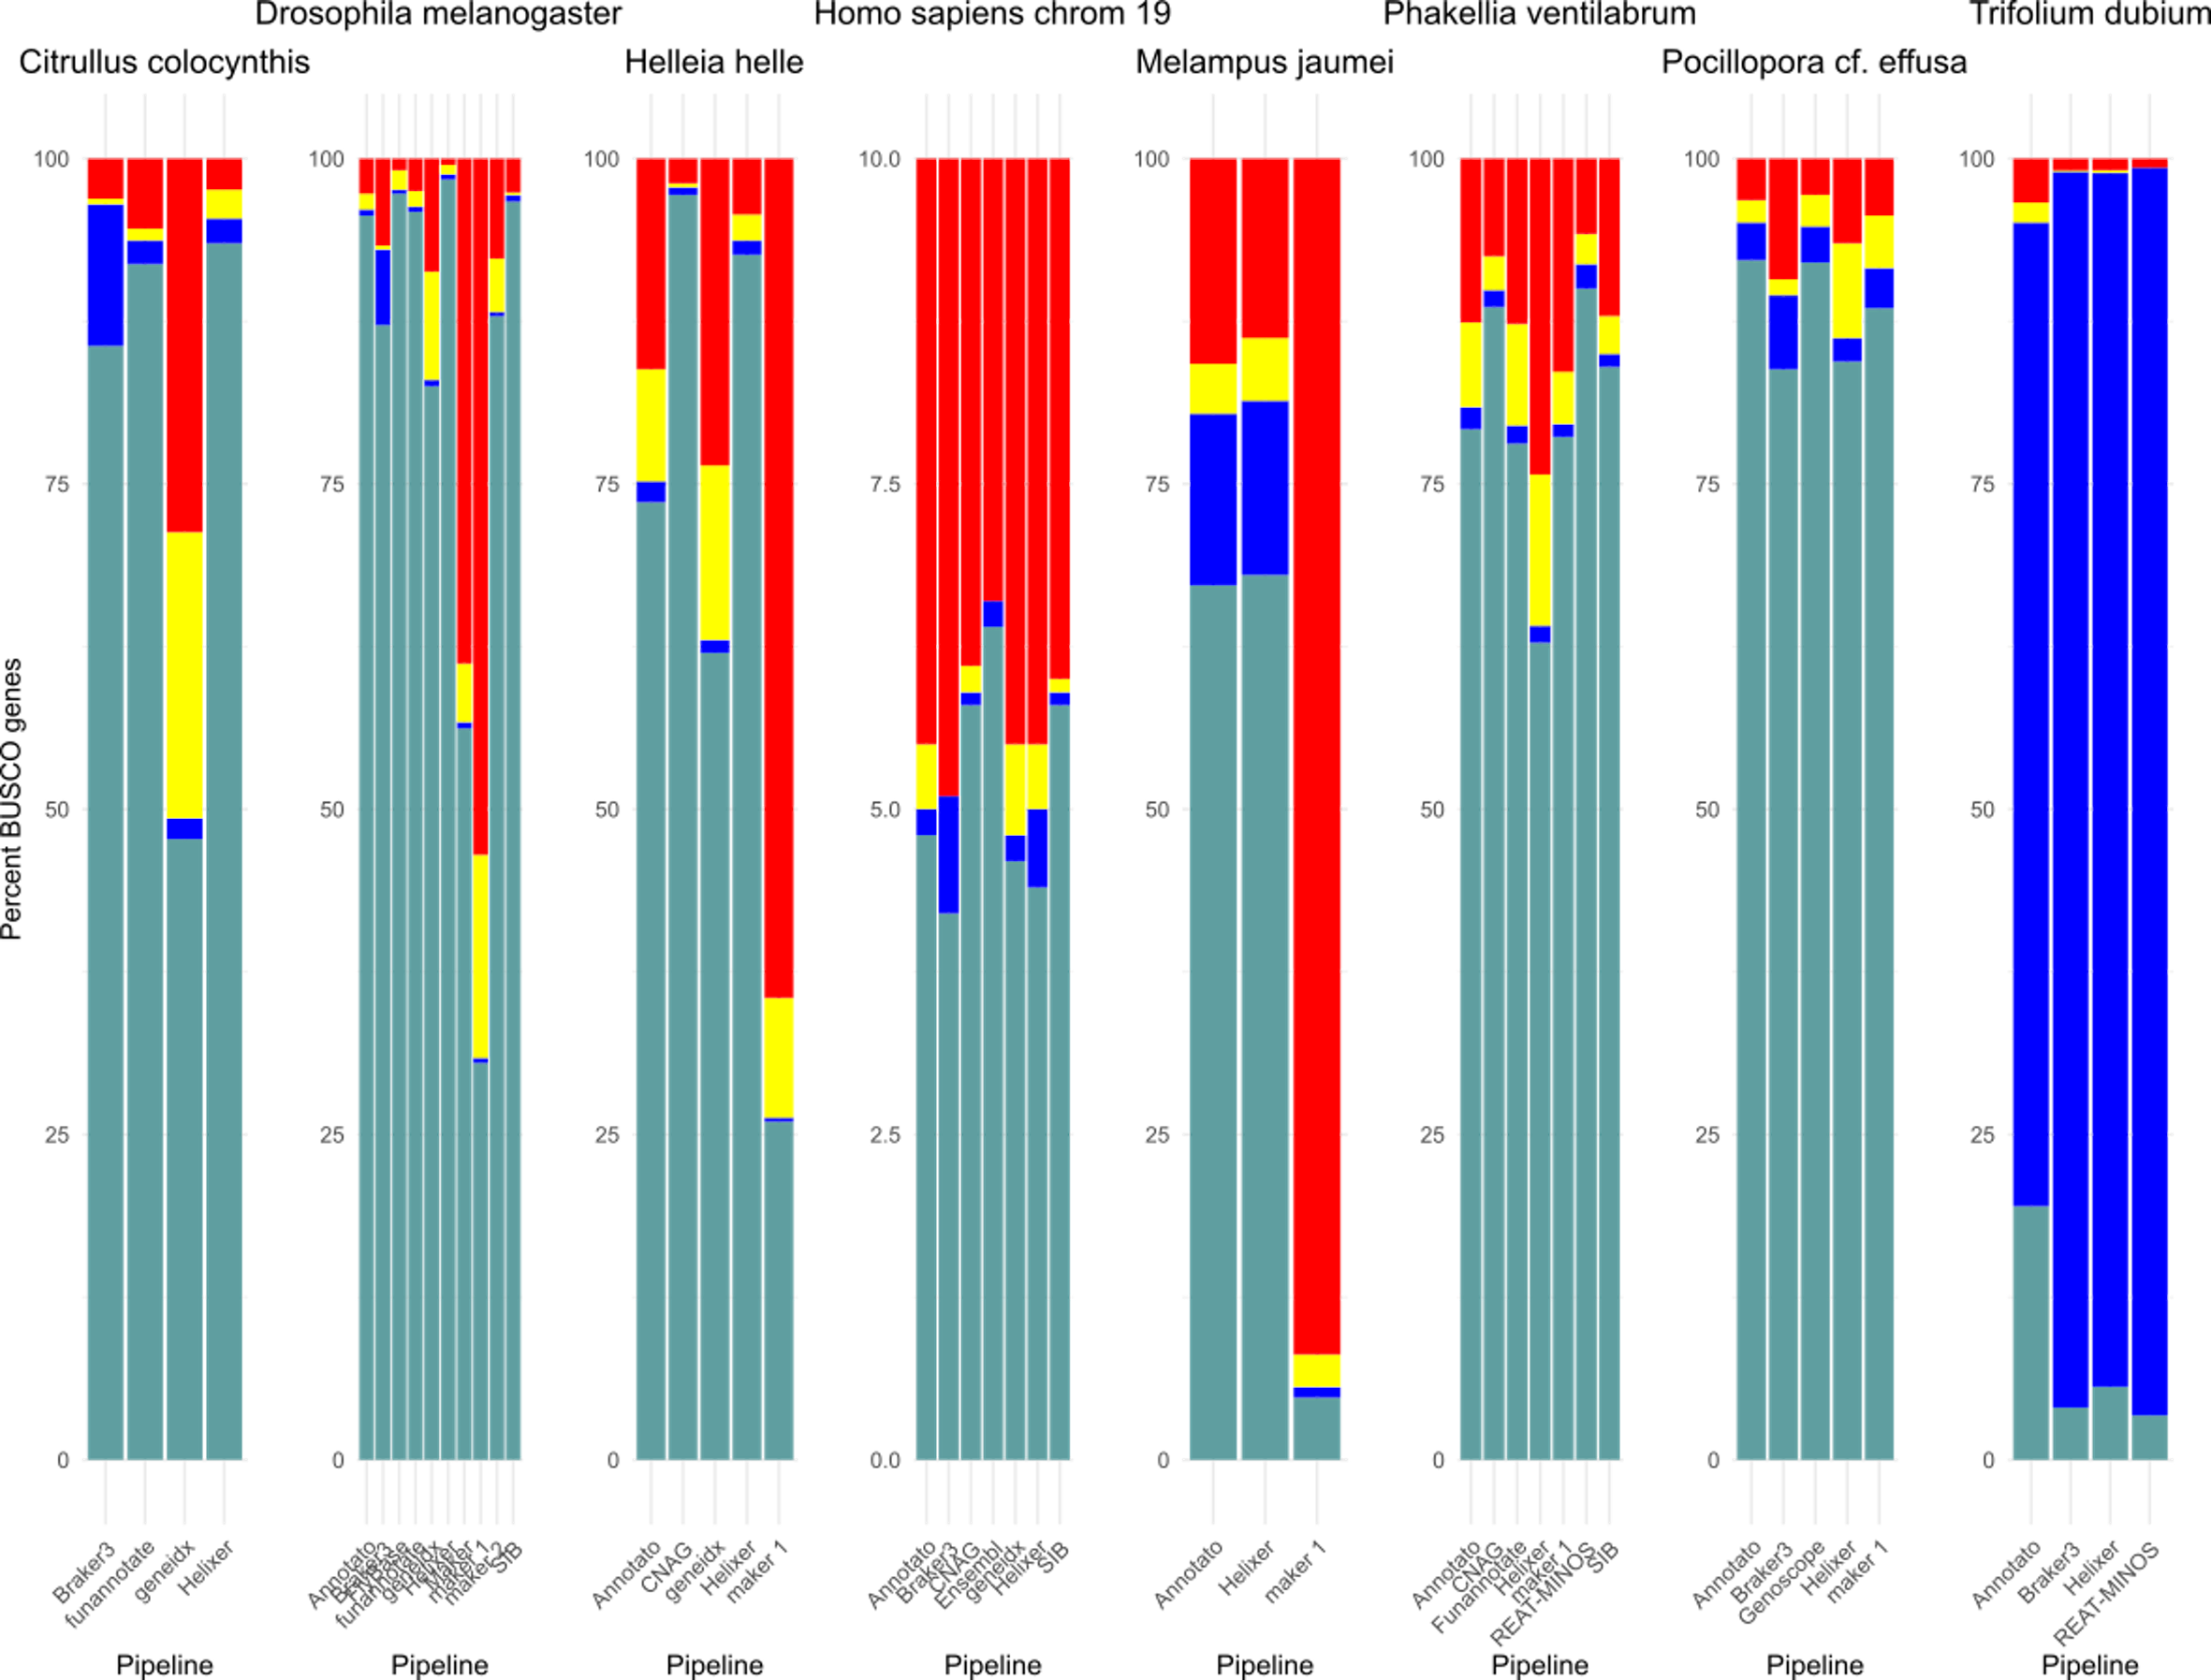
BUSCO completeness scores for each annotation. For each protein sequence in the BUSCO database of the respective line...
BUSCO completeness scores for each annotation. For each protein sequence in the BUSCO database of the respective lineage, the sequence is marked as present in a Single-Copy (light-blue) or Duplicated (dark-blue), present but Fragmented (yellow) or Missing (Red) from the annotated protein sequences. Note: As only chromosome 19 of the human genome was used, y-scale is different.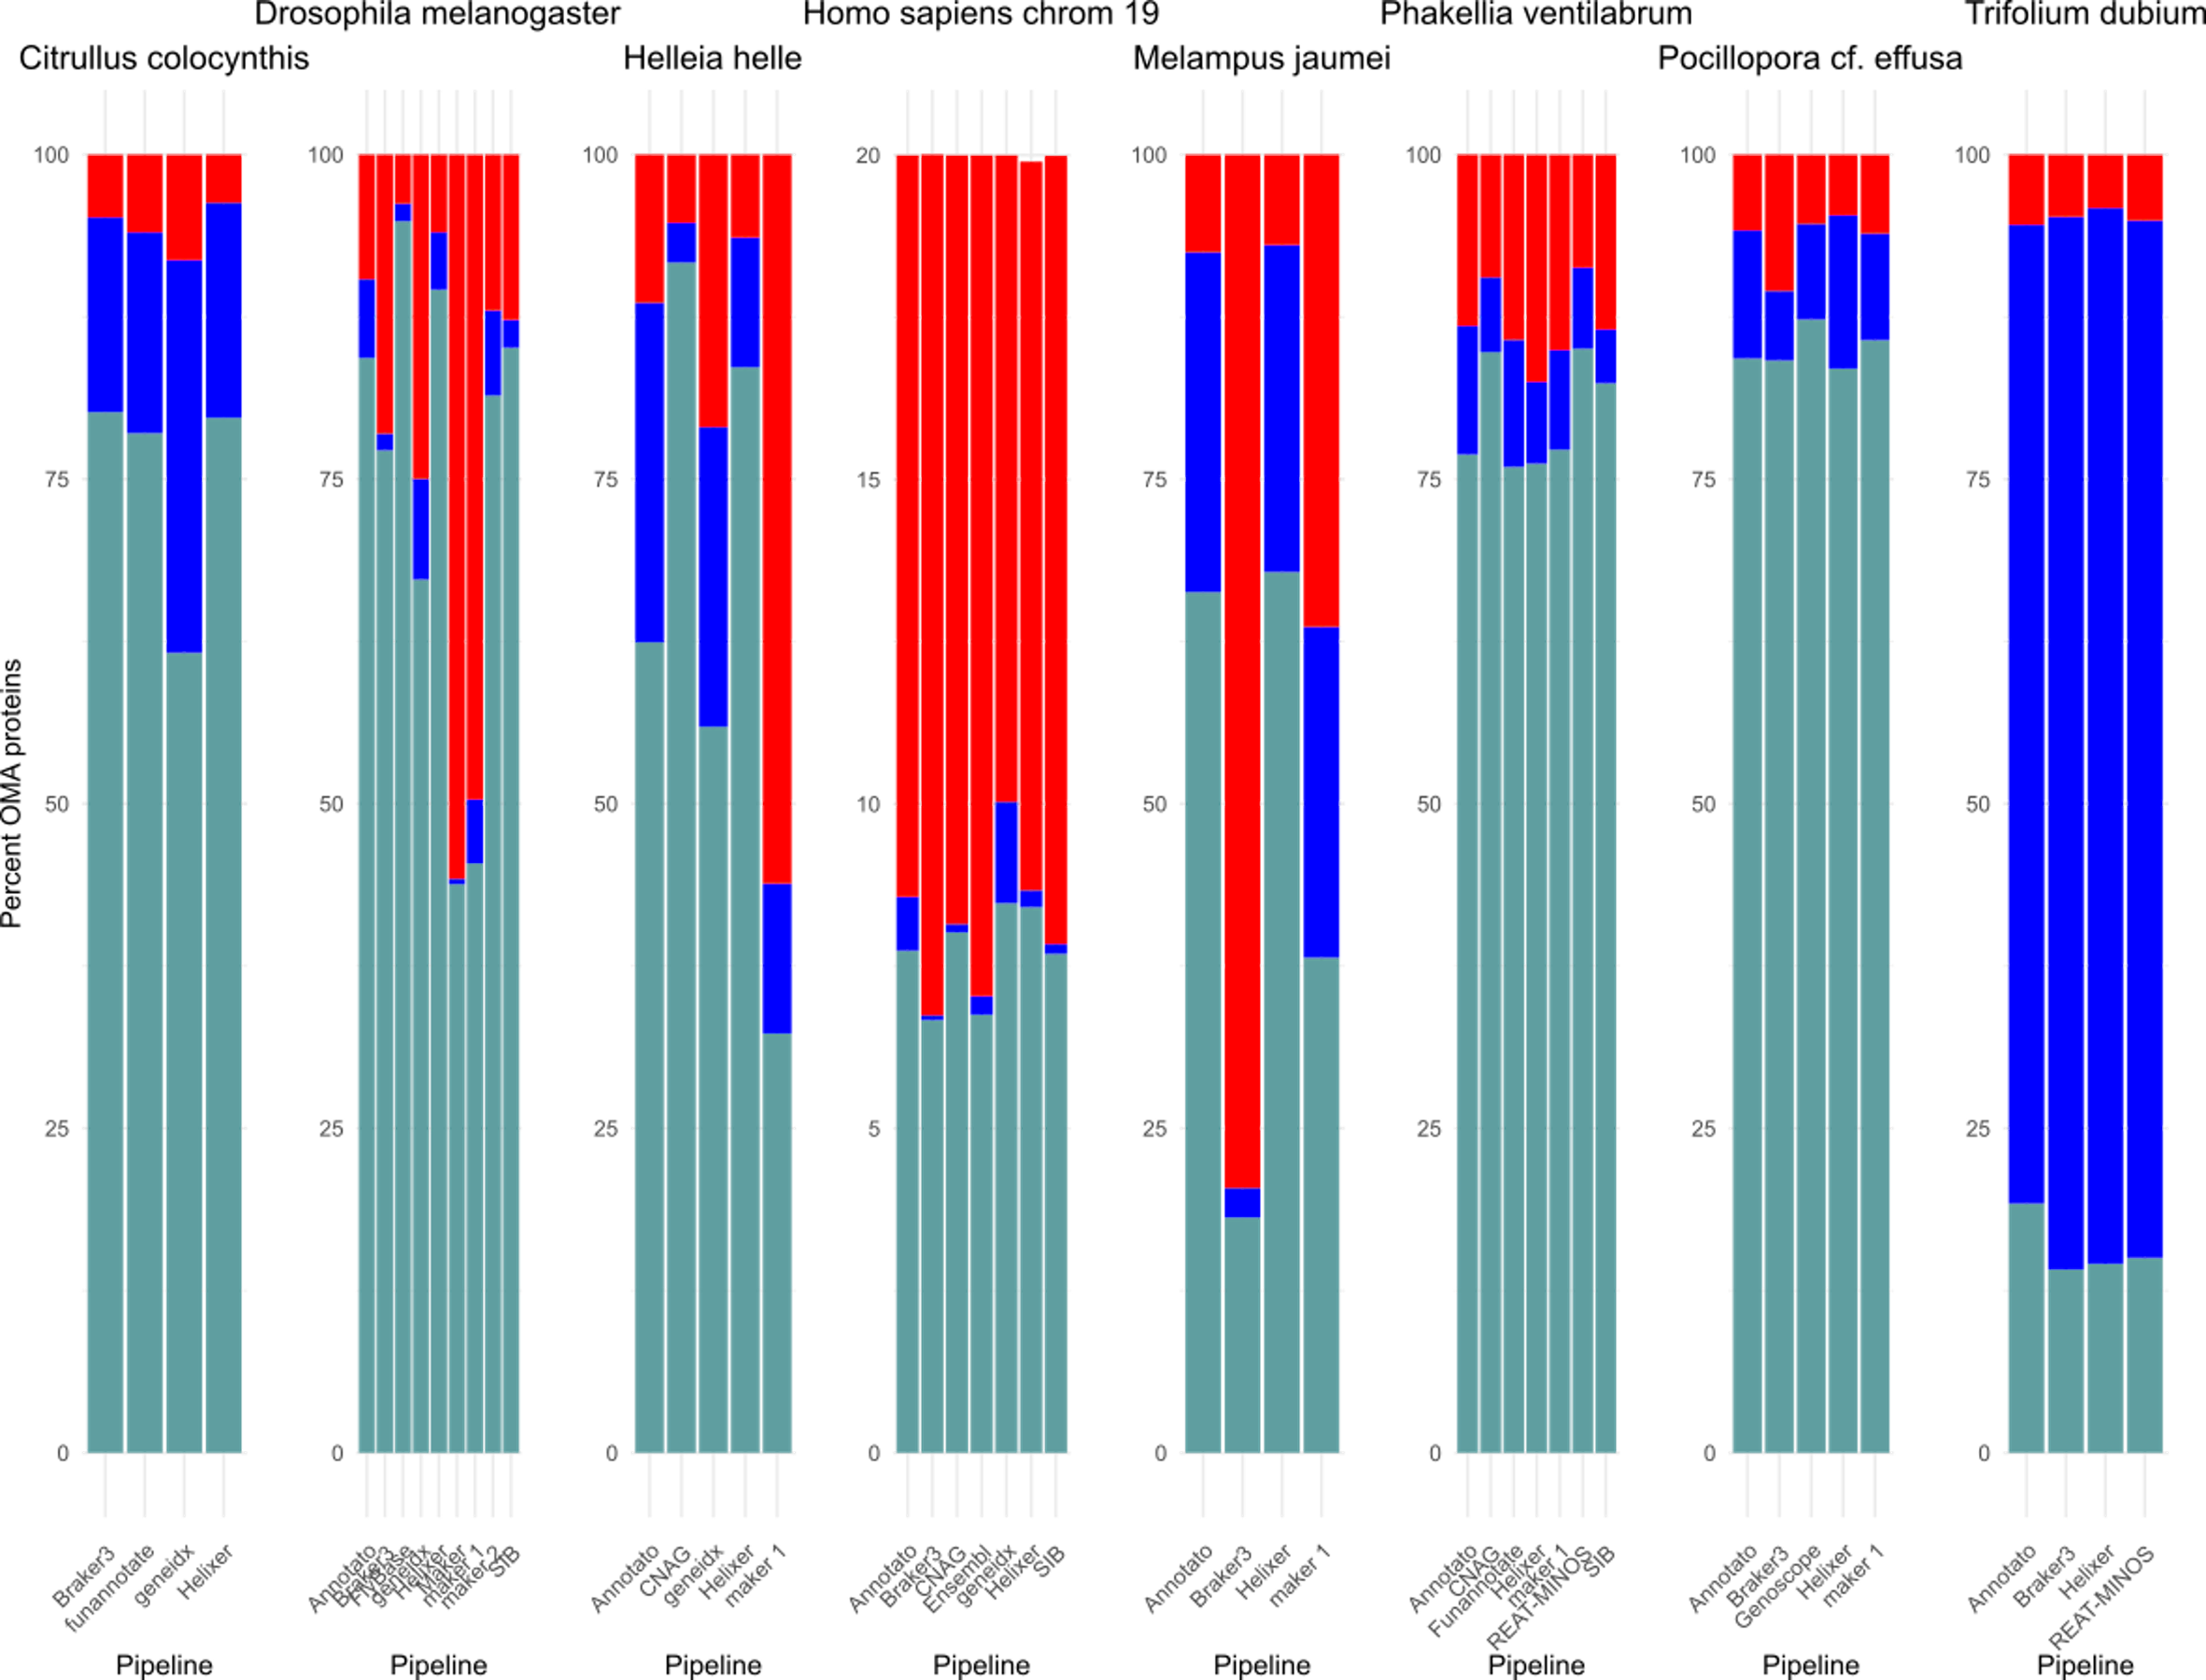
OMArk completeness scores for each annotation performed on each species genome. For each protein sequence in the OMAm...
OMArk completeness scores for each annotation performed on each species genome. For each protein sequence in the OMAmer database of the respective lineage, the sequence is marked as Missing (red) or Complete either once (Single - light blue) or multiple times (Duplicated - dark blue) based on its presence in the protein sequences of the given annotation. Note: As only chromosome 19 of the human genome was used, y-scale is different.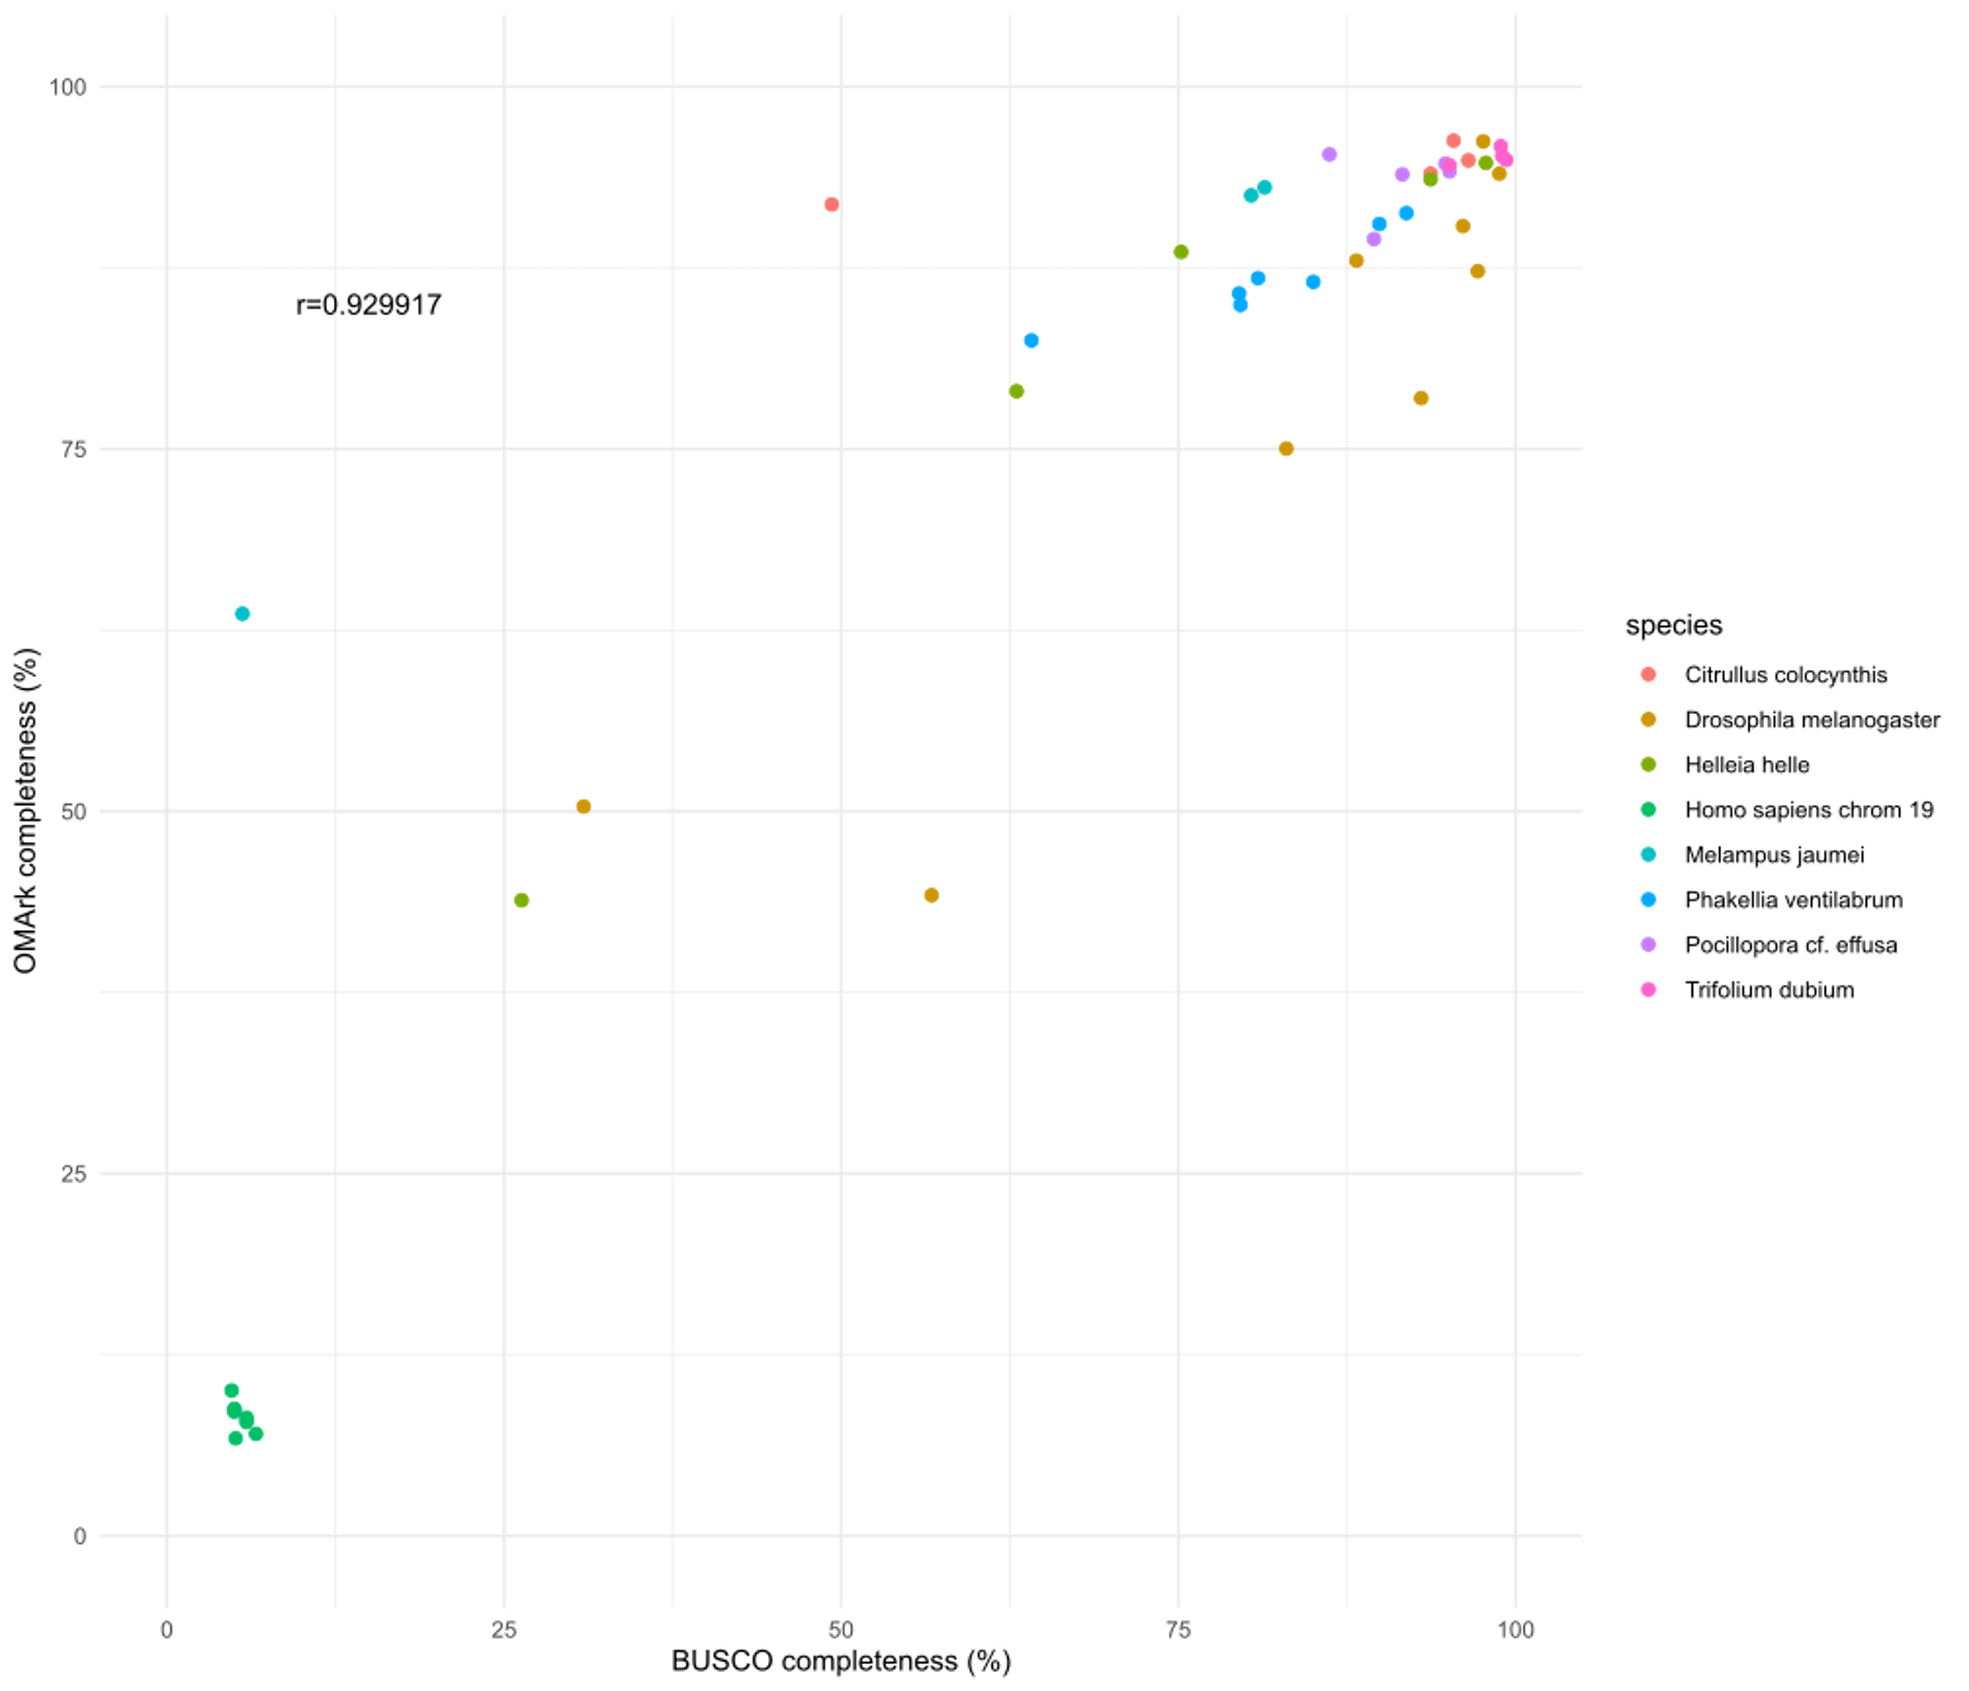
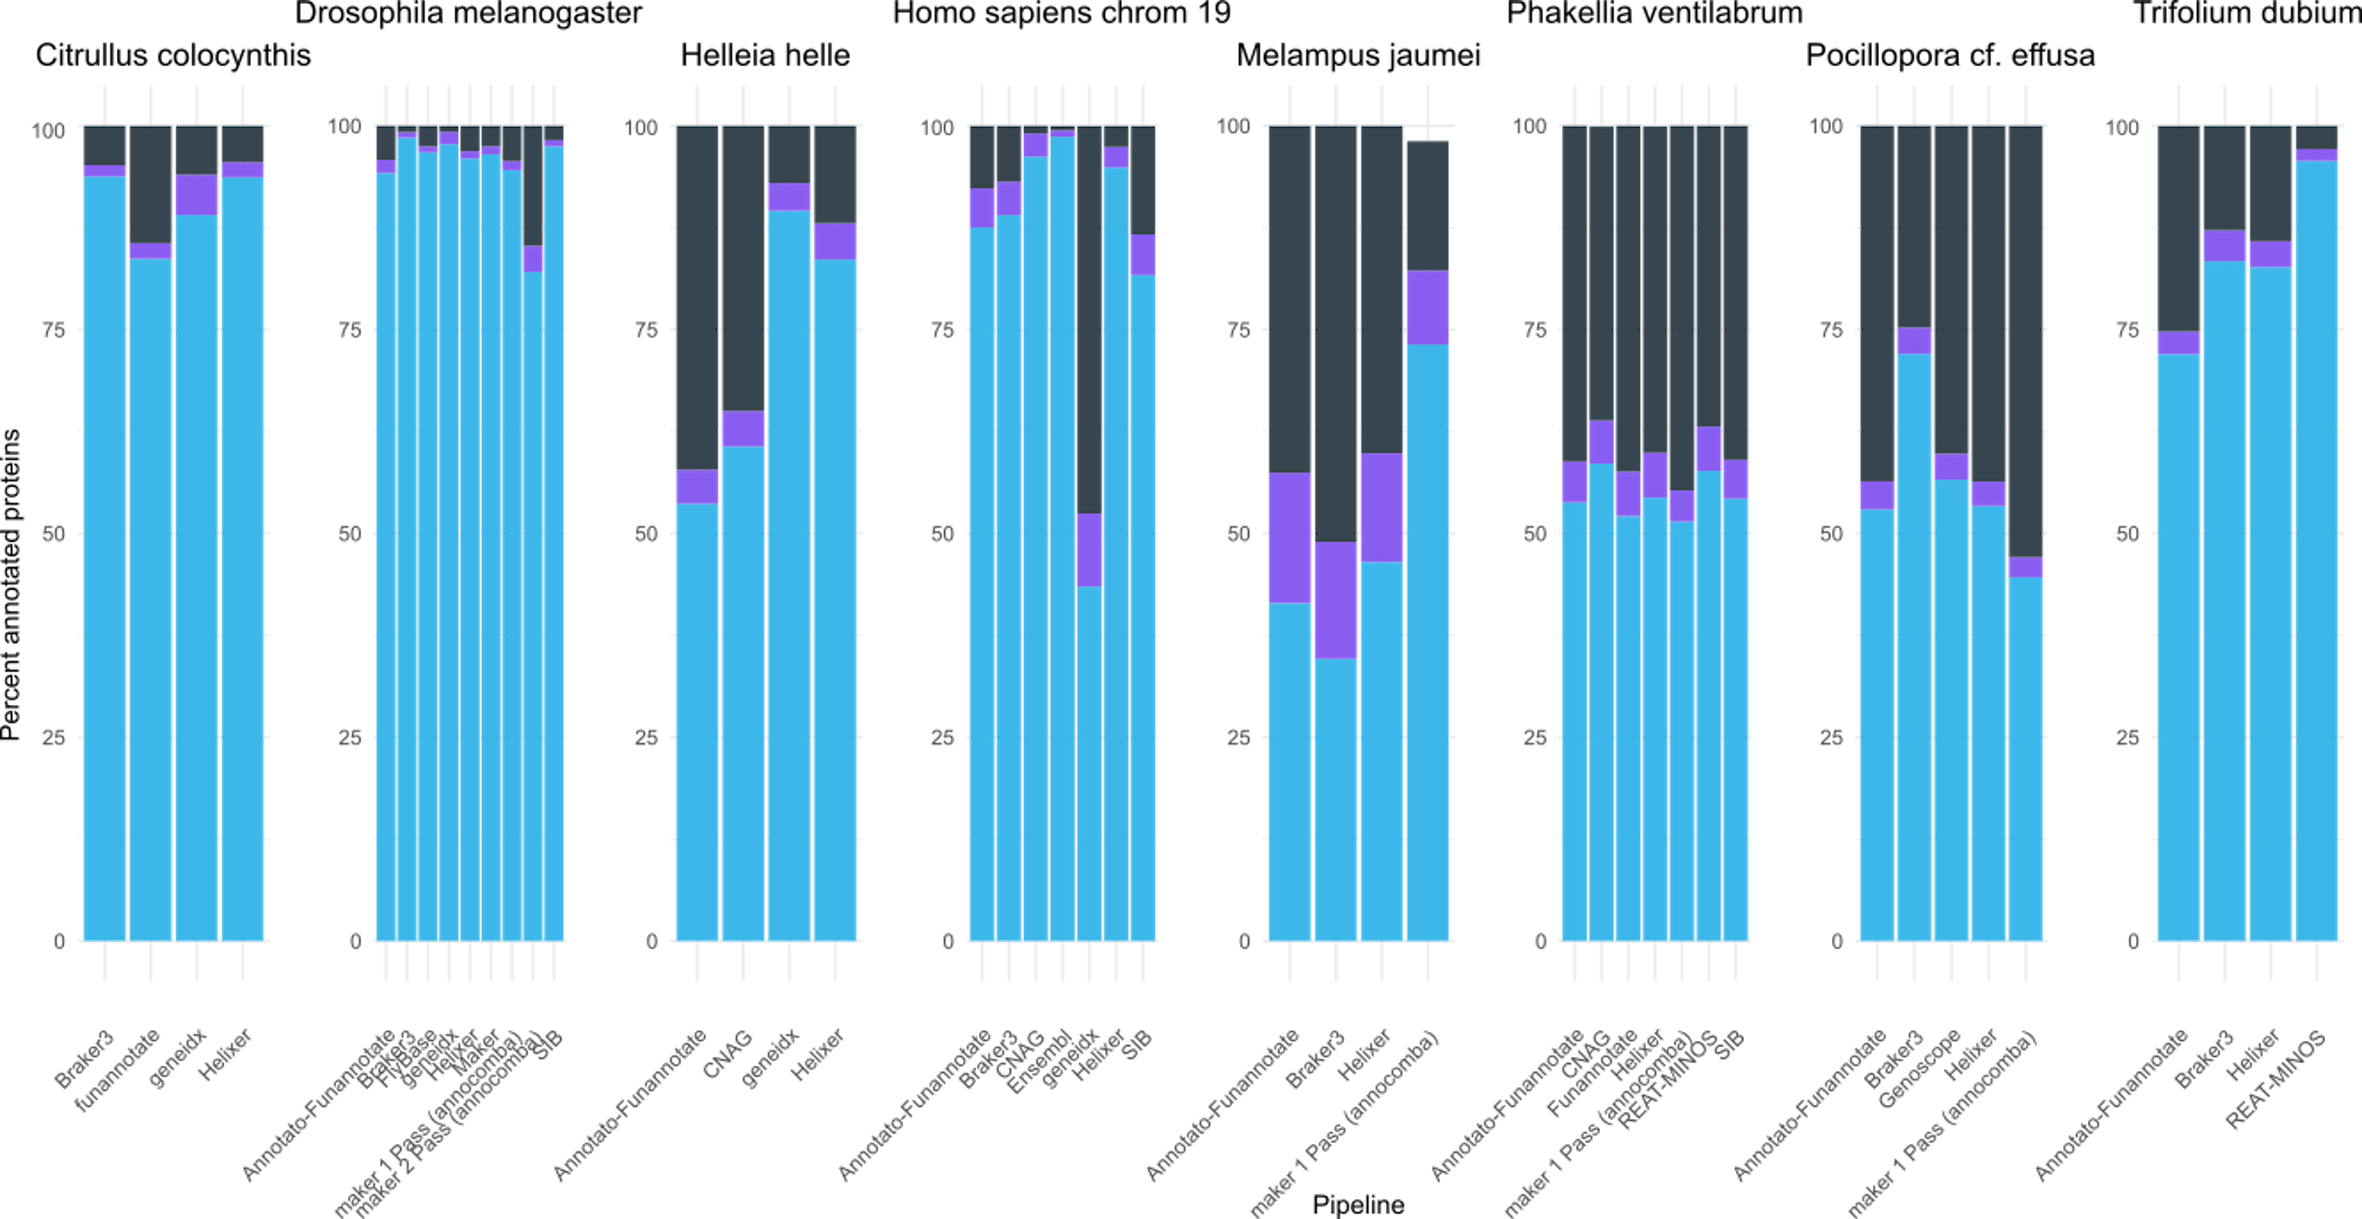
OMArk consistency scores for each annotation performed on each species genome. Each protein sequence annotated as par...
OMArk consistency scores for each annotation performed on each species genome. Each protein sequence annotated as part of a particular pipeline was marked by OMArk as being Consistent (light-blue) with the species lineage, Inconsistent (purple) or Unknown (grey) - i.e., not present in the OMAmer database.