Phenological Diversity Trends with Remote Sensing Datacubes
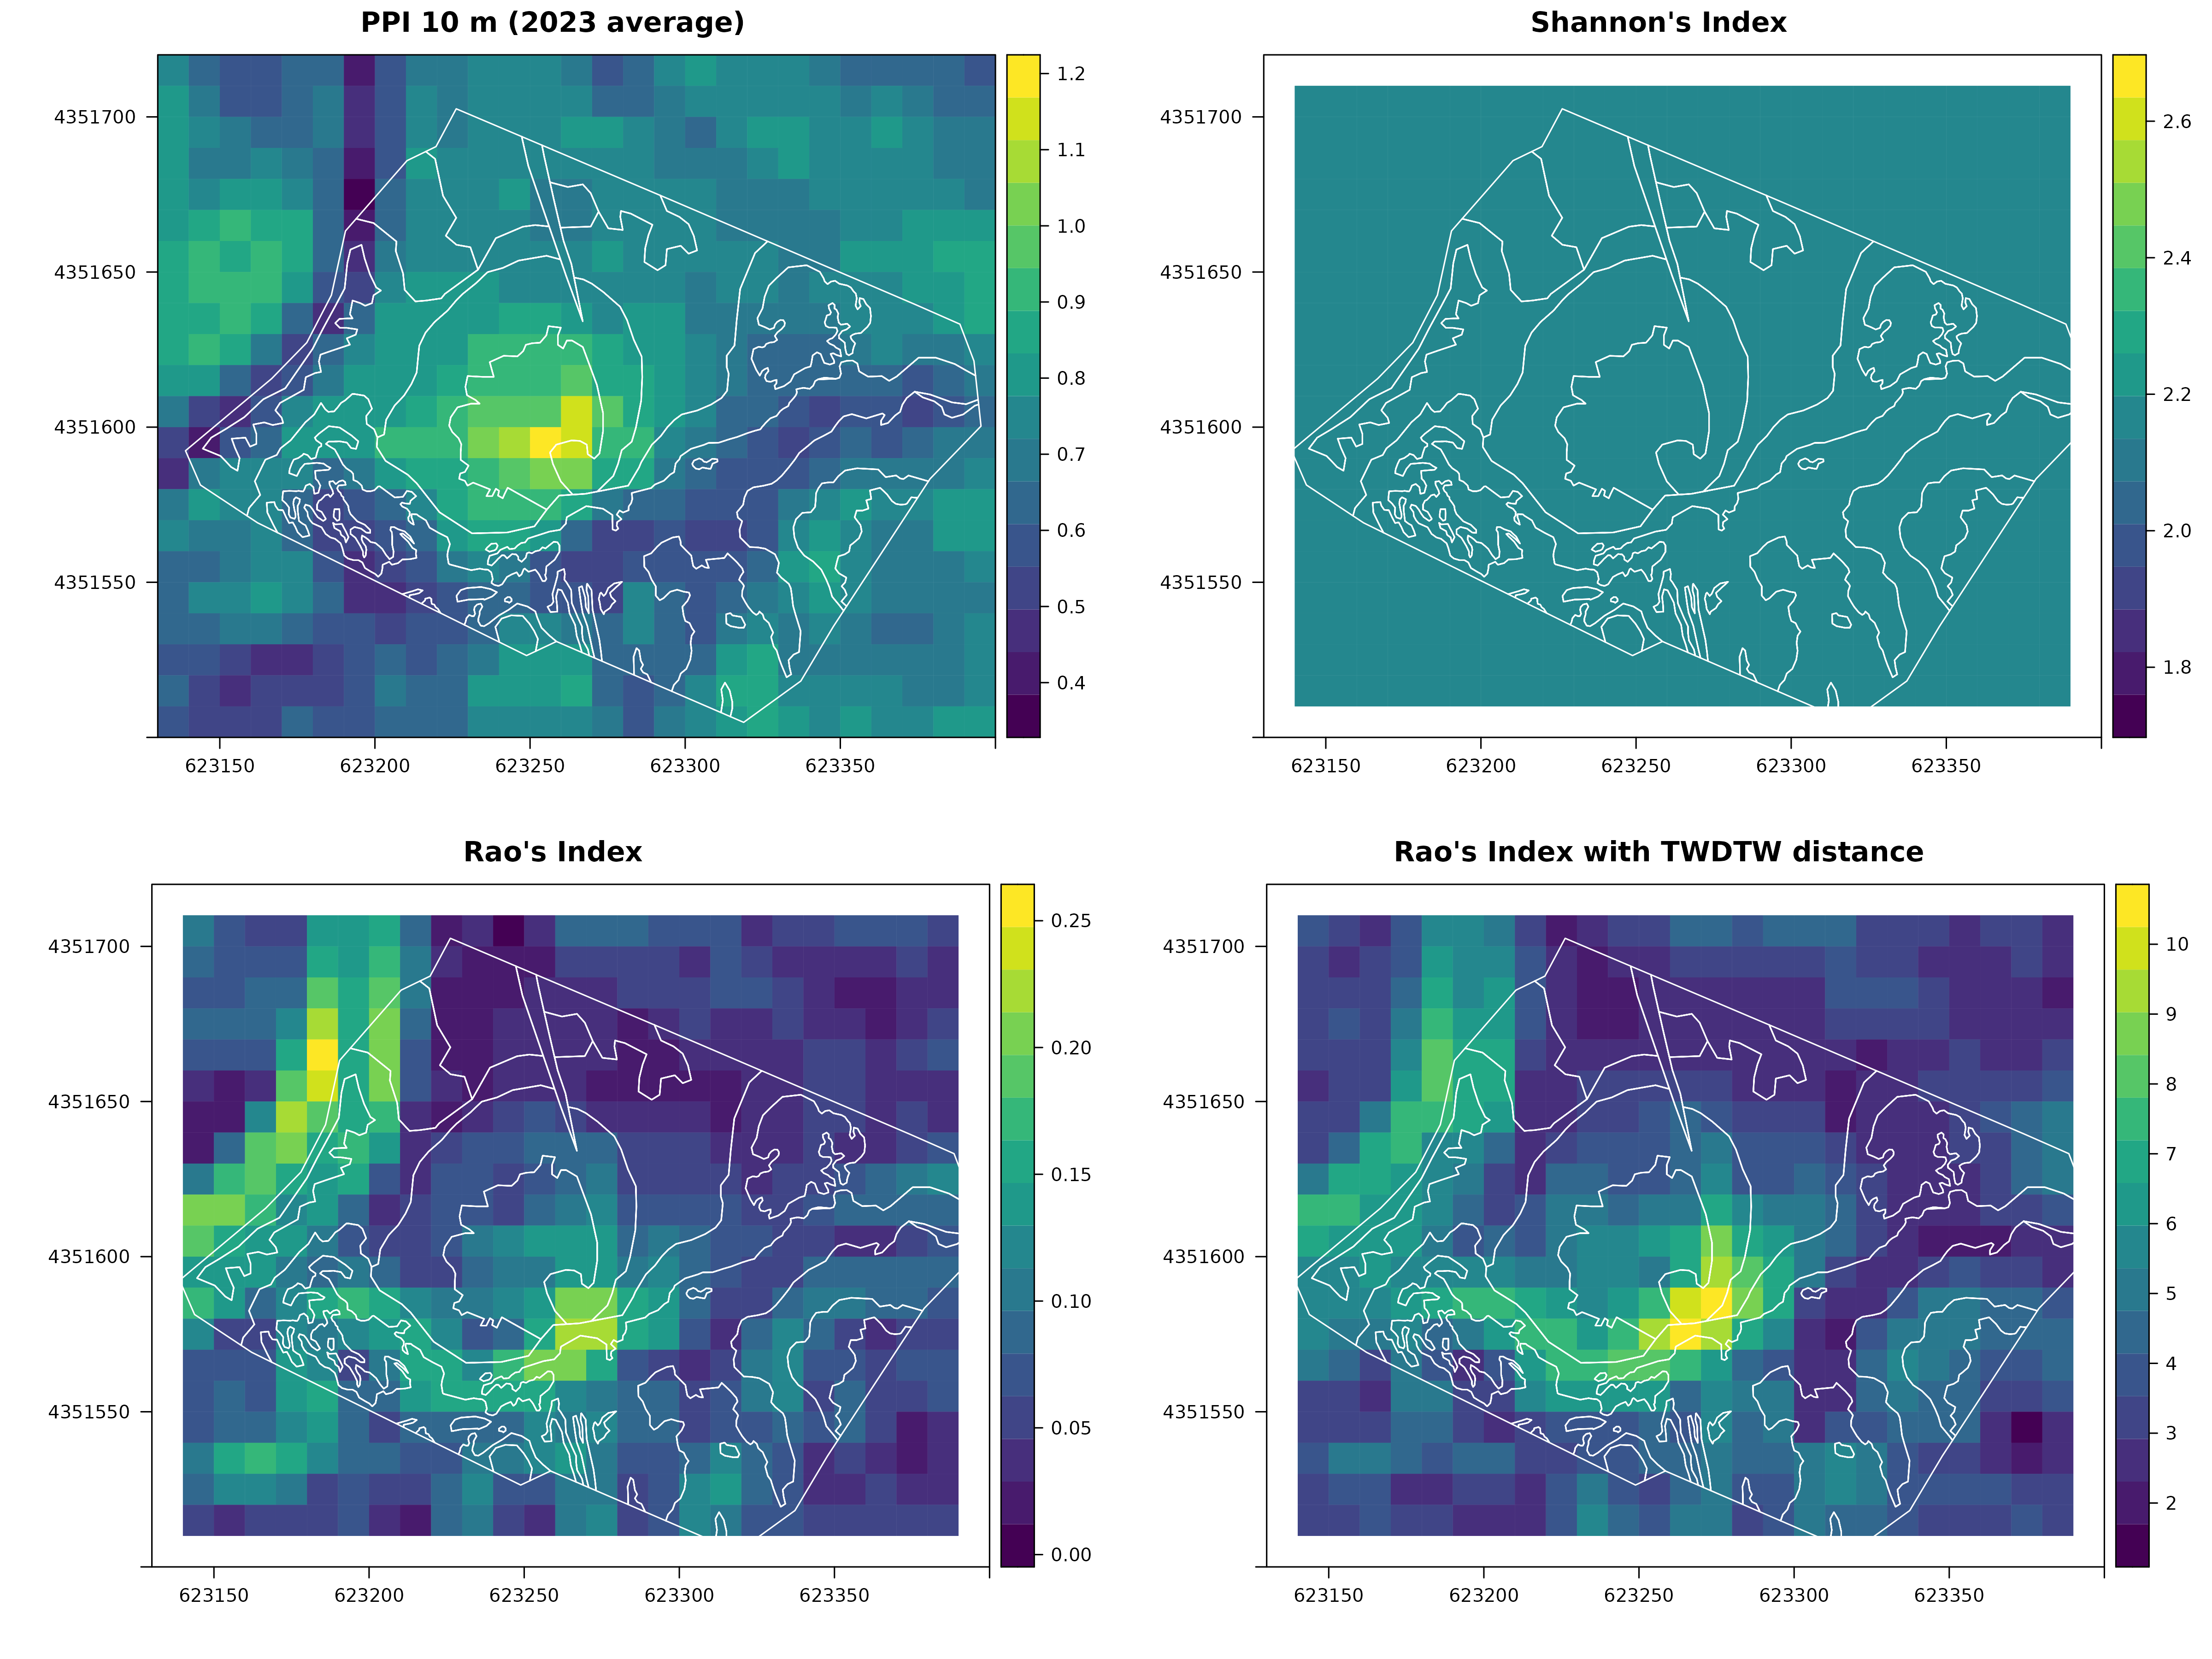
During the 2024 B-Cubed Hackathon, we extended the R package “rasterdiv” by incorporating Time-Weighted Dynamic Time Warping (TWDTW) to the package’s pre-existing paRao() function for the calculation of parametric Rao’s Quadratic Diversity (Rao’s Q) index. This expands the user’s ability to biodiversity trends when using time series of Earth Observations. Biodiversity indices like Shannon’s H do not consider spatio-temporal dynamics, and others (e.g. Rao’s Q) only incorporate geographic distance between observations, often leaving phenological variation overlooked.Through integrating TWDTW into the paRao() function, users can assess different facets of an ecosystem’s biodiversity by incorporating phenological differences among its plant communities. This is also valuable to distinguish between natural habitats that follow a seasonal phenological trend and artificial land cover types, which may lack phenological changes. Previous studies have also found that the time weighting ability of TWDTW enables the discernment of different floral community types which could otherwise be misclassified as the same with traditional Dynamic Time Warping (DTW).To evaluate the efficacy of TWDTW within the paRao() function, we compared the ability of TWDTW Rao’s Q index against other biodiversity indices at classifying the different plant communities in a disturbed grassland in Calabria, Italy. Our study used a Plant Phenological Index (PPI) time series from the Sentinel-2 satellite network. The results indicated that accounting for phenological cycles can filter out artefacts and better distinguish habitats with differing plant species diversity. This improves the ability to assess ecosystem changes through space and time, providing a more comprehensive understanding of biodiversity dynamics, and the ability to gauge the resilience of different vegetation patches.We conclude that the inclusion of plant phenology in biodiversity assessment is necessary, and that our modifications to paRao() will be valuable to facilitate the accurate detection and description of ecosystem trends in response to our changing environment.
Figures
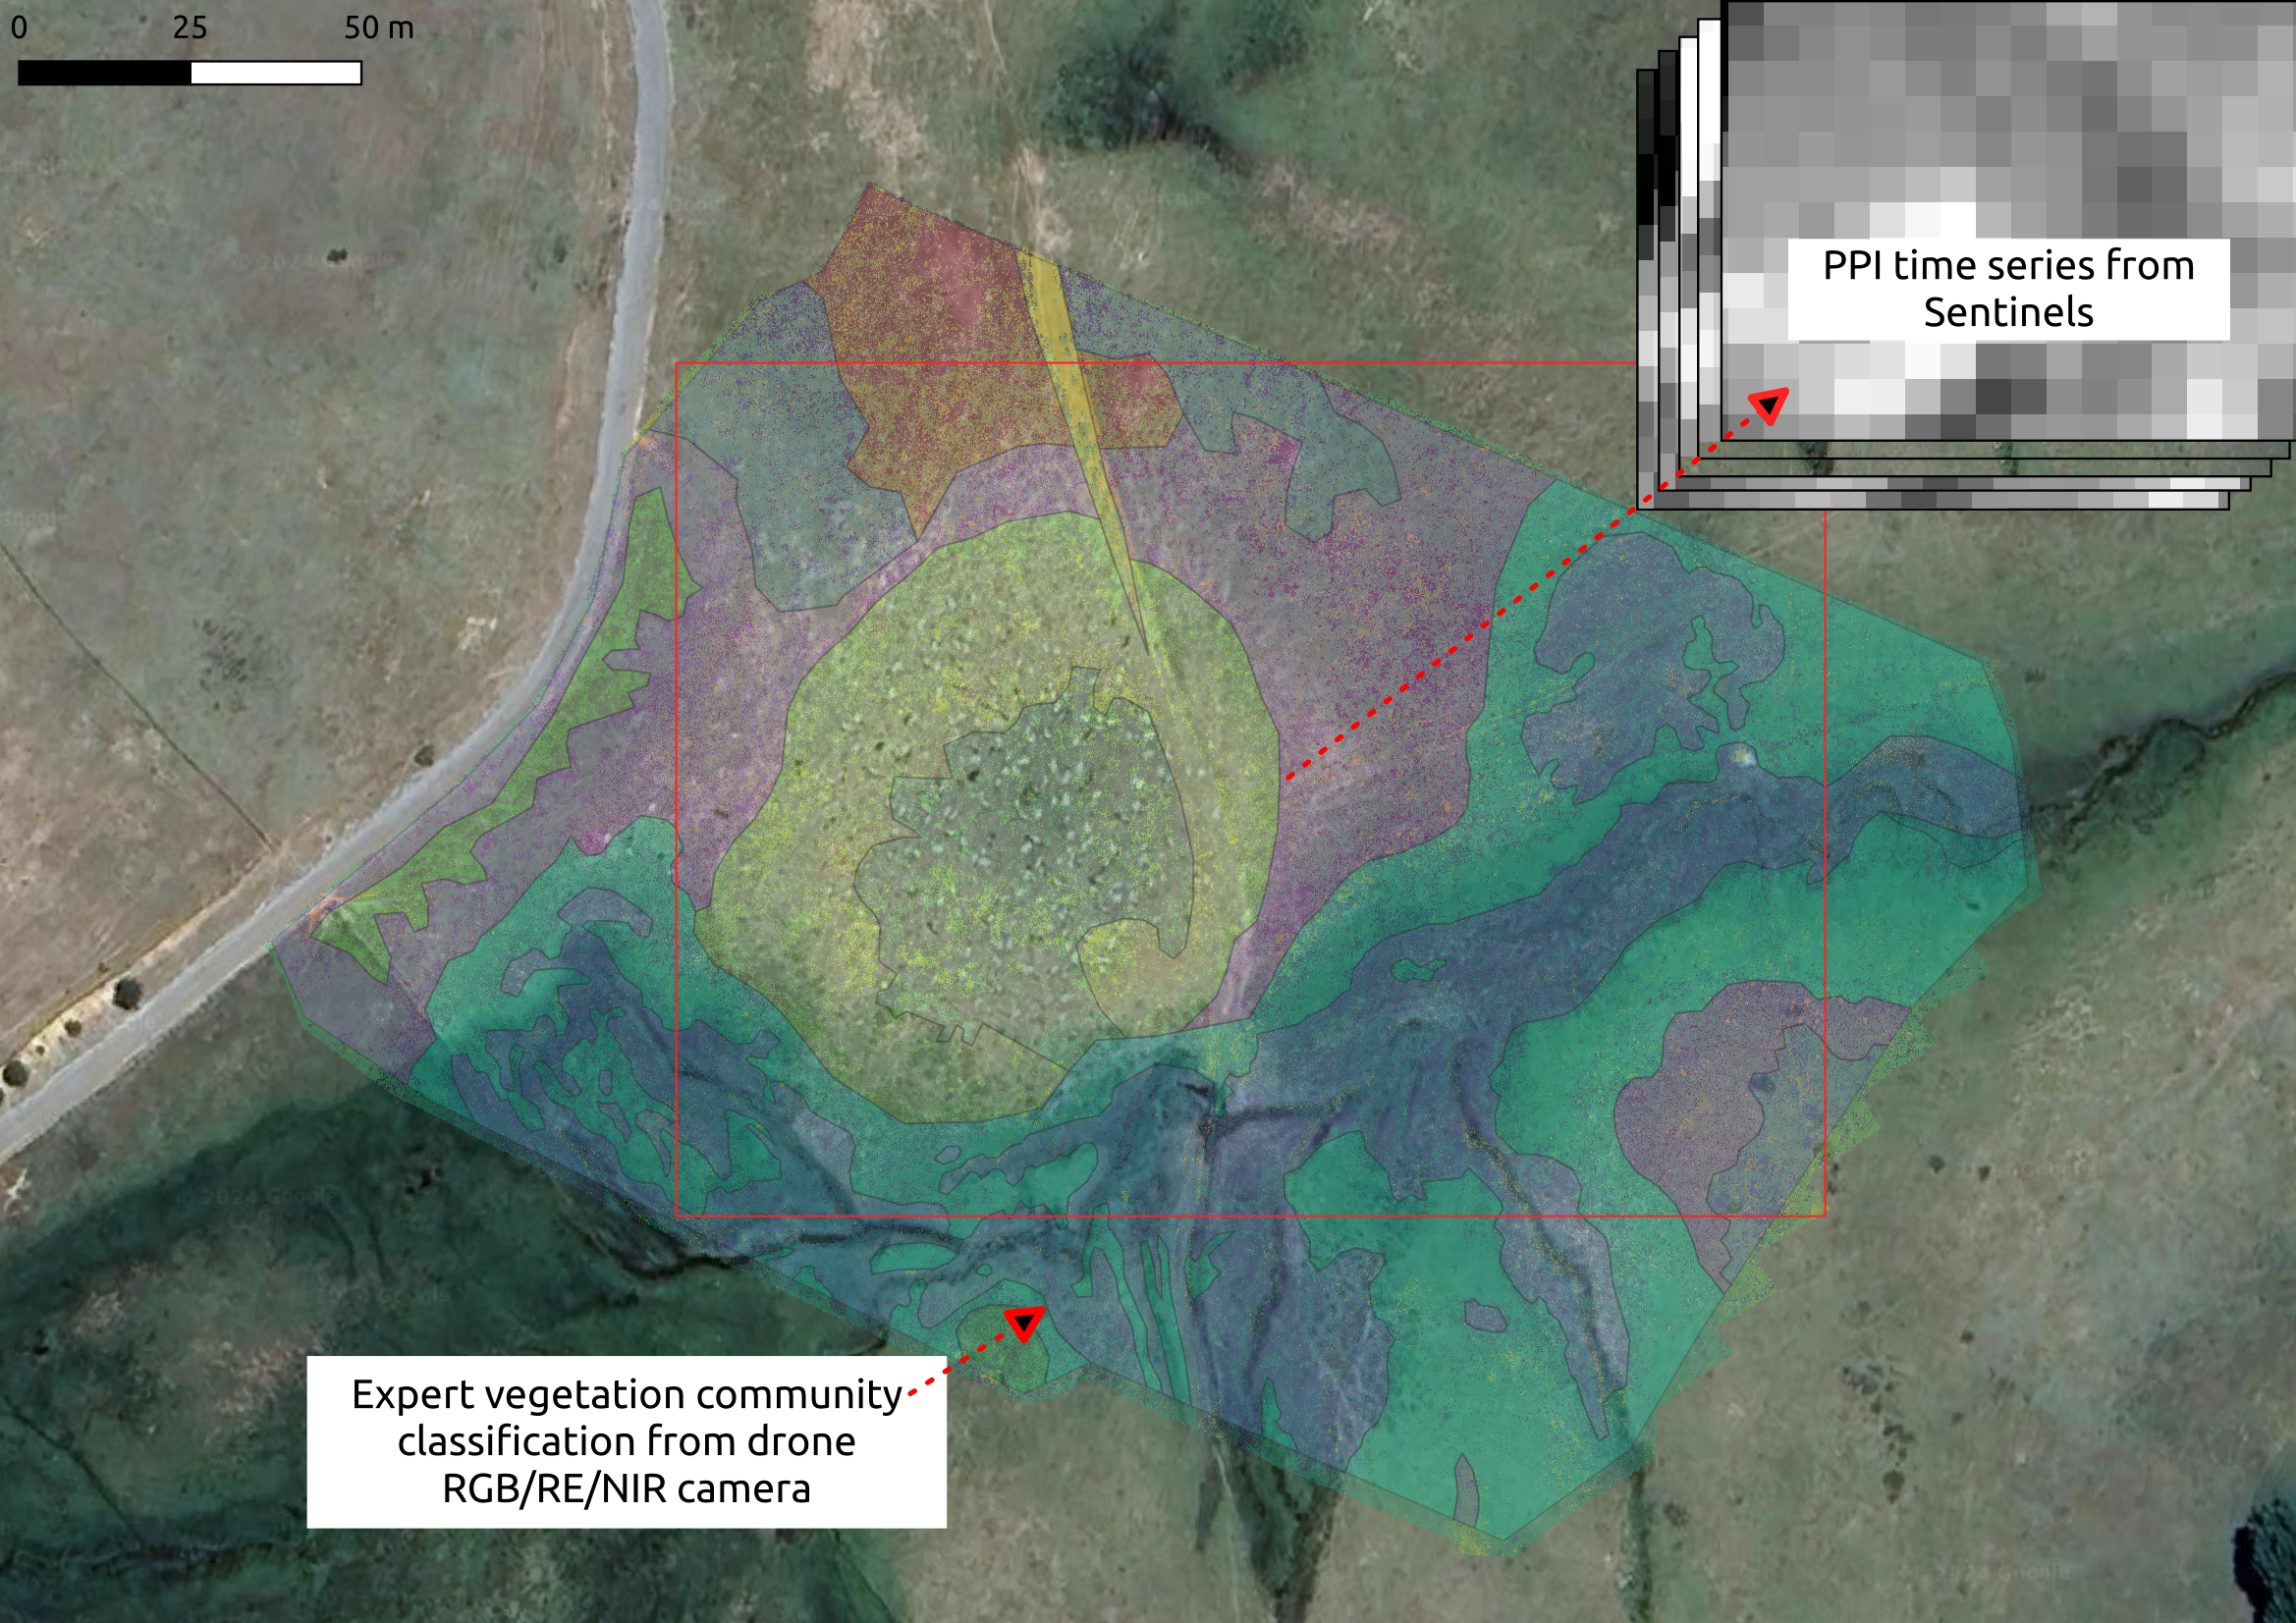
A true colour RGB satellite image (Map data: Google, Maxar Technologies 2023) giving an overview of the study site an...
A true colour RGB satellite image (Map data: Google, Maxar Technologies 2023) giving an overview of the study site and its surroundings within Calabria. The eight different plant community types are overlaid as differently coloured masks in transparency upon the image. The subset of the study site which was extracted from Sentinel-2 data is indicated within the red rectangle.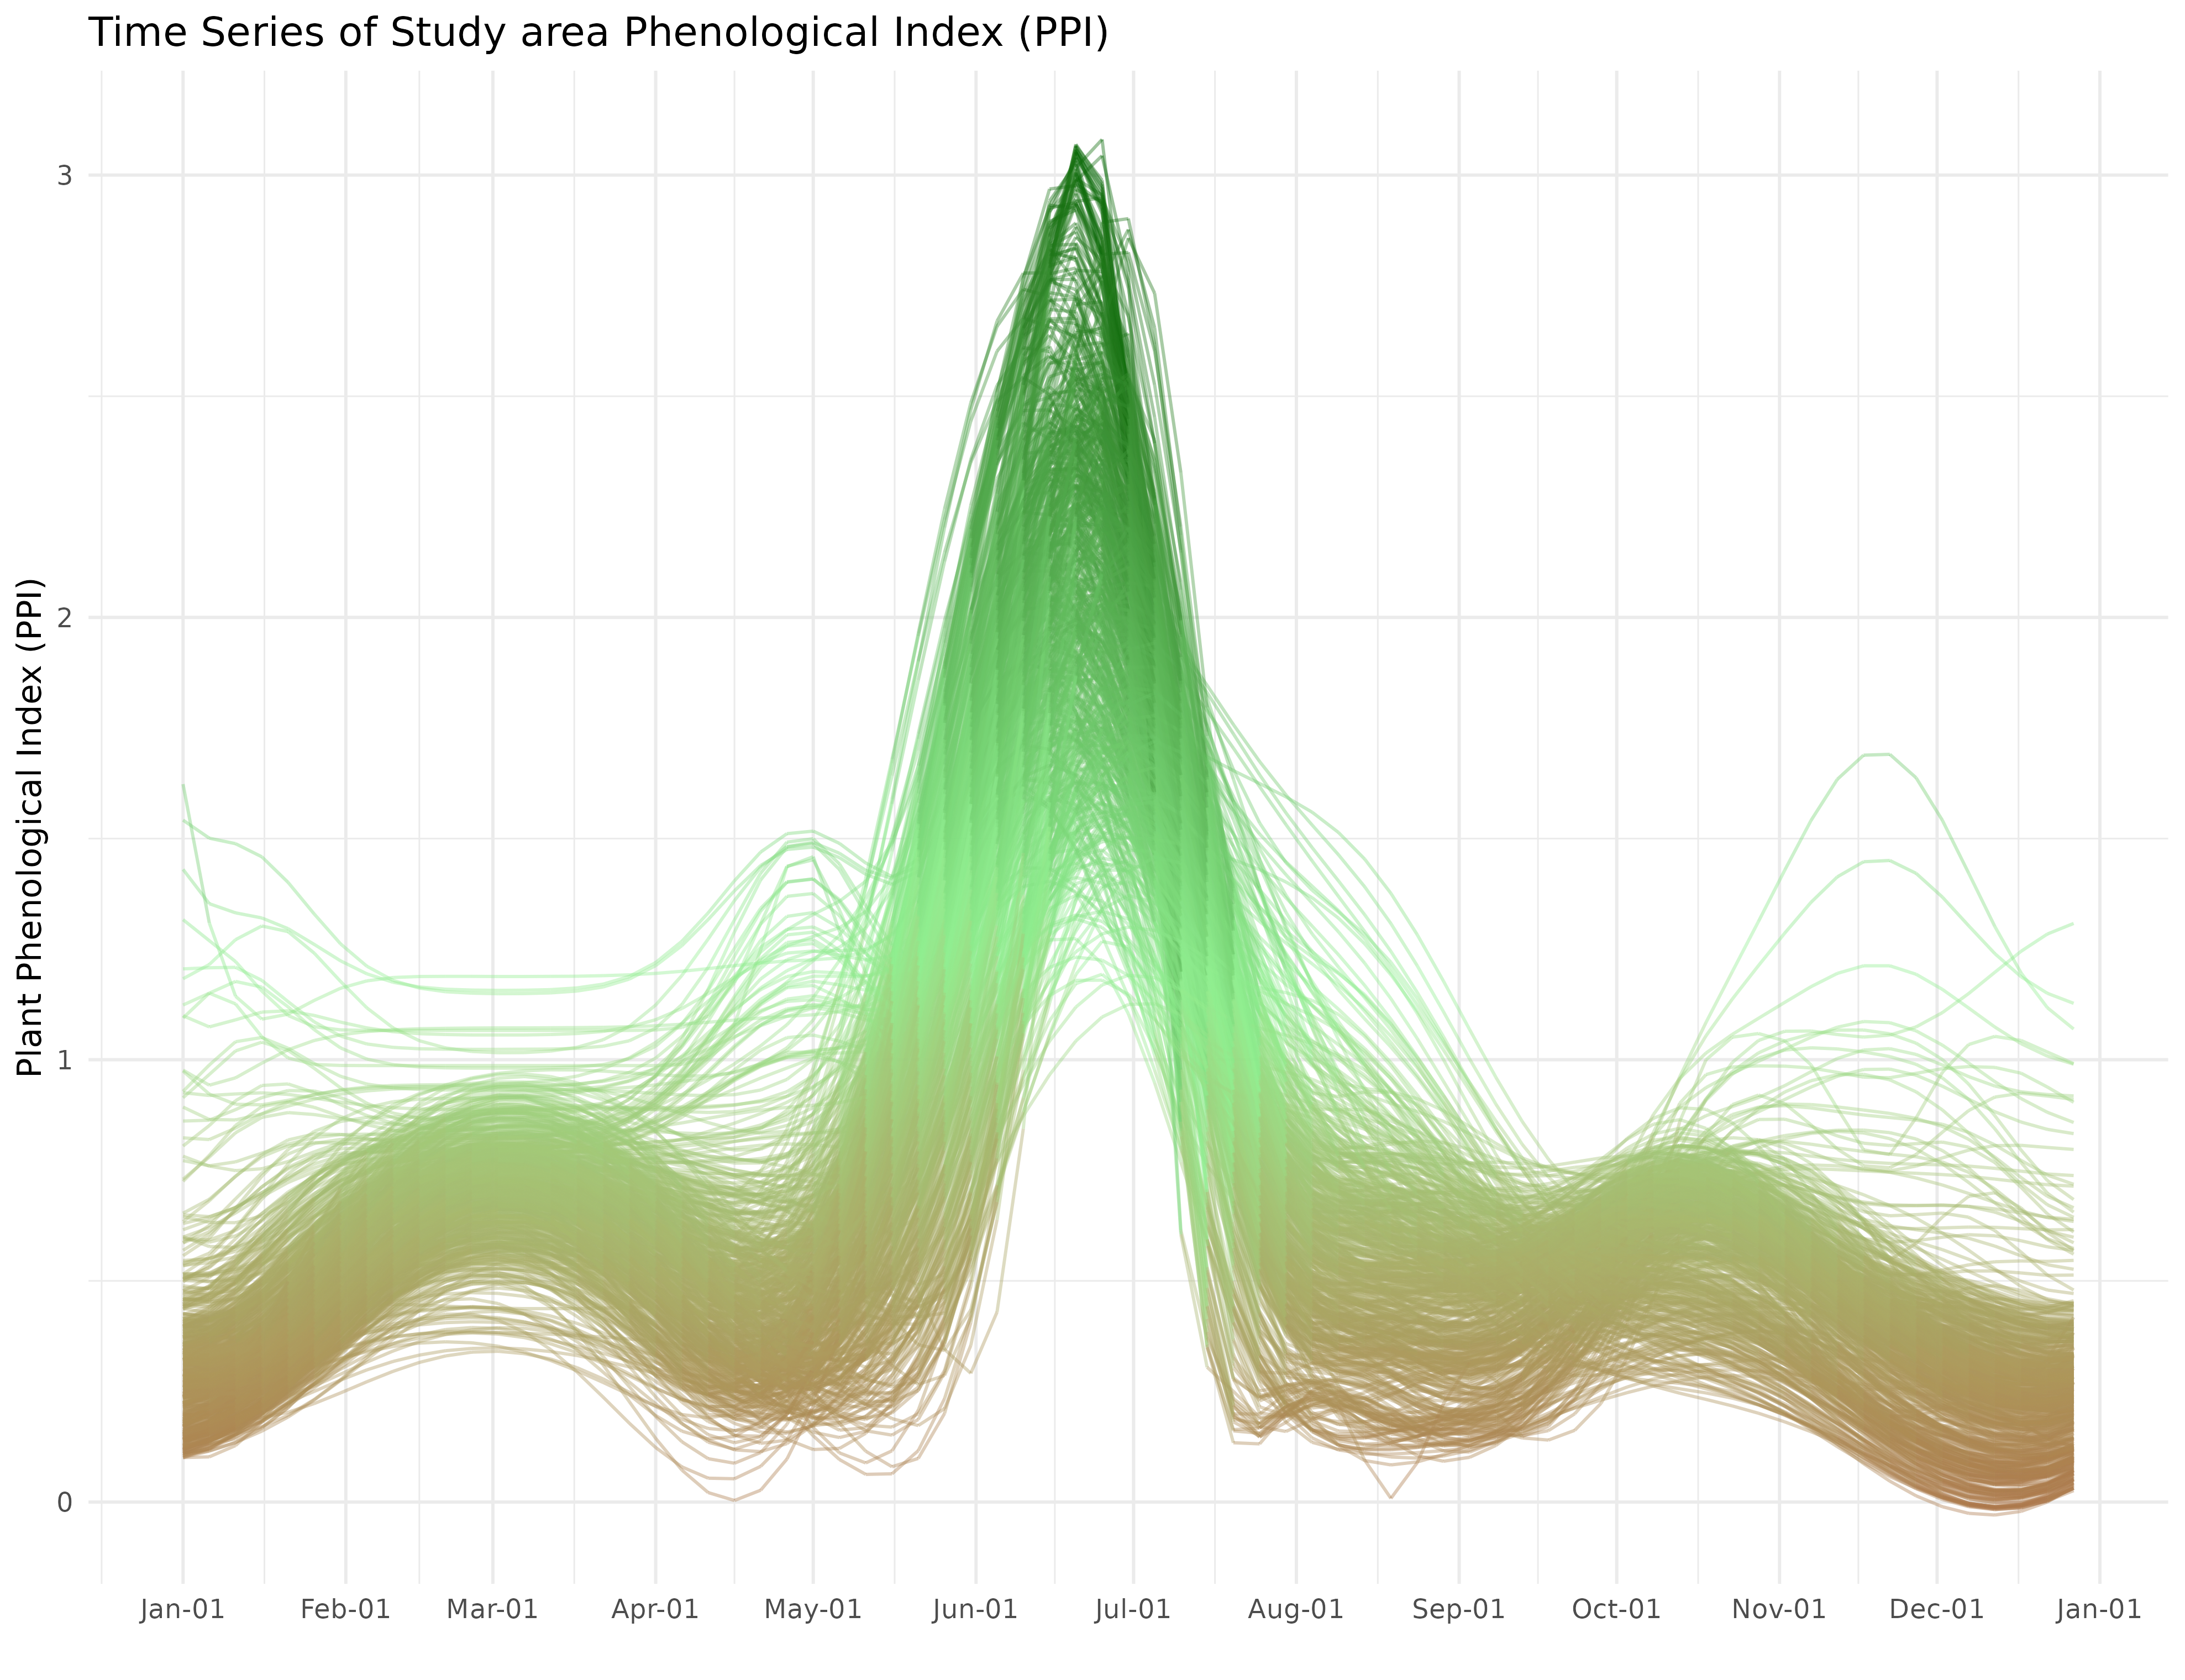
A time series illustrating changes in the value of the Plant Phenological Index (PPI) for every pixel within the Macc...
A time series illustrating changes in the value of the Plant Phenological Index (PPI) for every pixel within the Macchia Sacra Special Protection Area study site in Calabria.