1st SpatialData Developer Workshop
This pre-print is aimed at sharing the results of the “1st SpatialData workshop,” an in-person event organized by the SpatialData team and funded by the Chan Zuckerberg Initiative (CZI) that brought together expertise from different fields, including methods developers of a variety of tools for single-cell and spatial omics. The purpose is to explore new directions to advance the field of spatial omics. By leveraging multiple programming languages, including Python, R, and JavaScript, the event focuses on four central hackathon tracks: R interoperability: This track aims to enhance the integration and compatibility of R and Python with the SpatialData Python framework by using the language-agnostic SpatialData Zarr file format (which follows, when possible, the NGFF specification). Visualization interoperability: This track is dedicated to improving the seamless integration of visualization tools across different systems and programming languages via a tool-agnostic view configuration. Scalability and benchmarking: Participants will identify, benchmark, and address computational bottlenecks within the SpatialData framework. Ergonomics and user-friendliness: This track focuses on enhancing the usability and accessibility of the SpatialData framework for both first-time users and third-party developers. These tracks aim to foster collaboration and innovation, driving advancements in the analysis and infrastructure of spatial omics and imaging data.
Figures
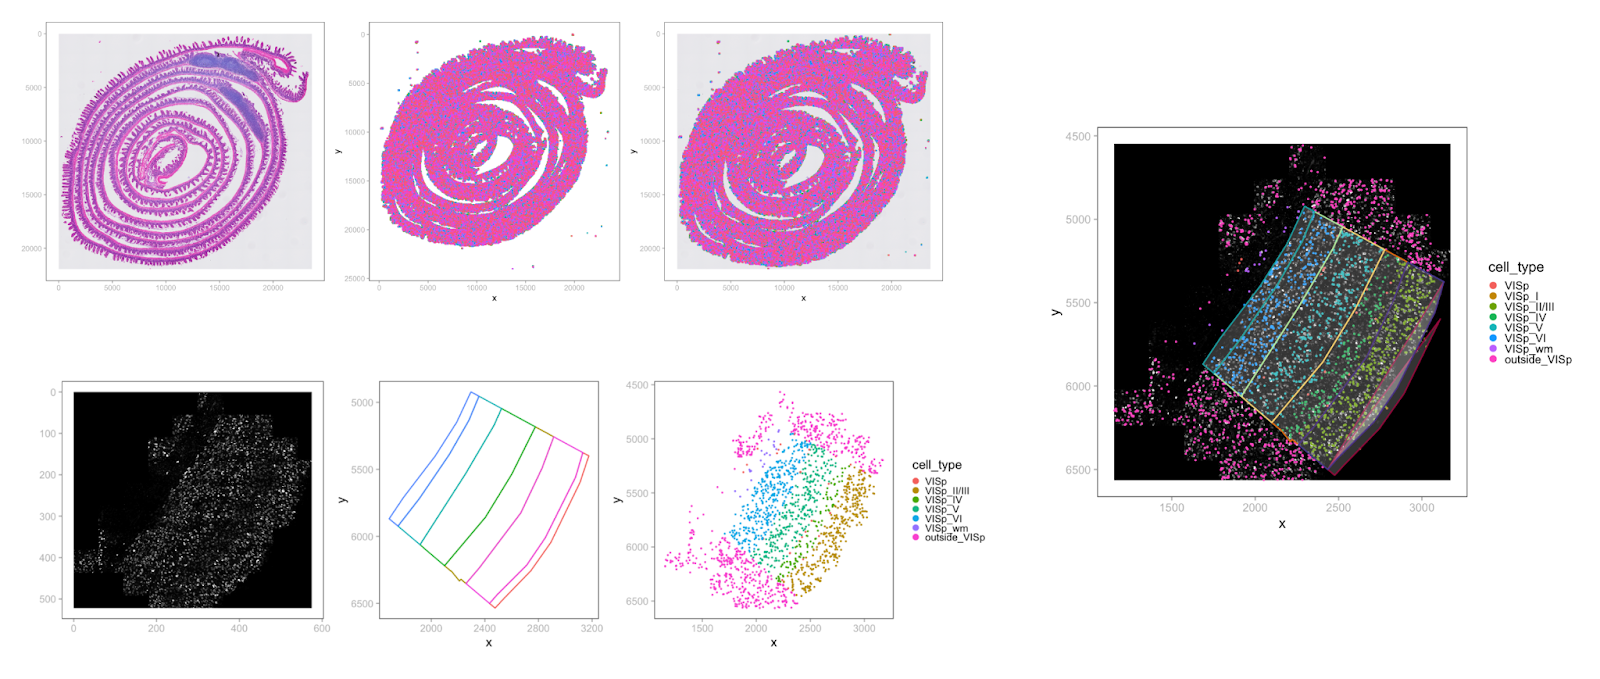
Example of visualization of SpatialData Zarr datasets from R. Top row: Visium HD mouse intestine dataset (from https:...
Example of visualization of SpatialData Zarr datasets from R. Top row: Visium HD mouse intestine dataset (from https://www.10xgenomics.com/datasets/visium-hd-cytassist-gene-expression-libraries-of-mouse-intestine). Bottom row, right: MERFISH prototype pipeline, mouse brain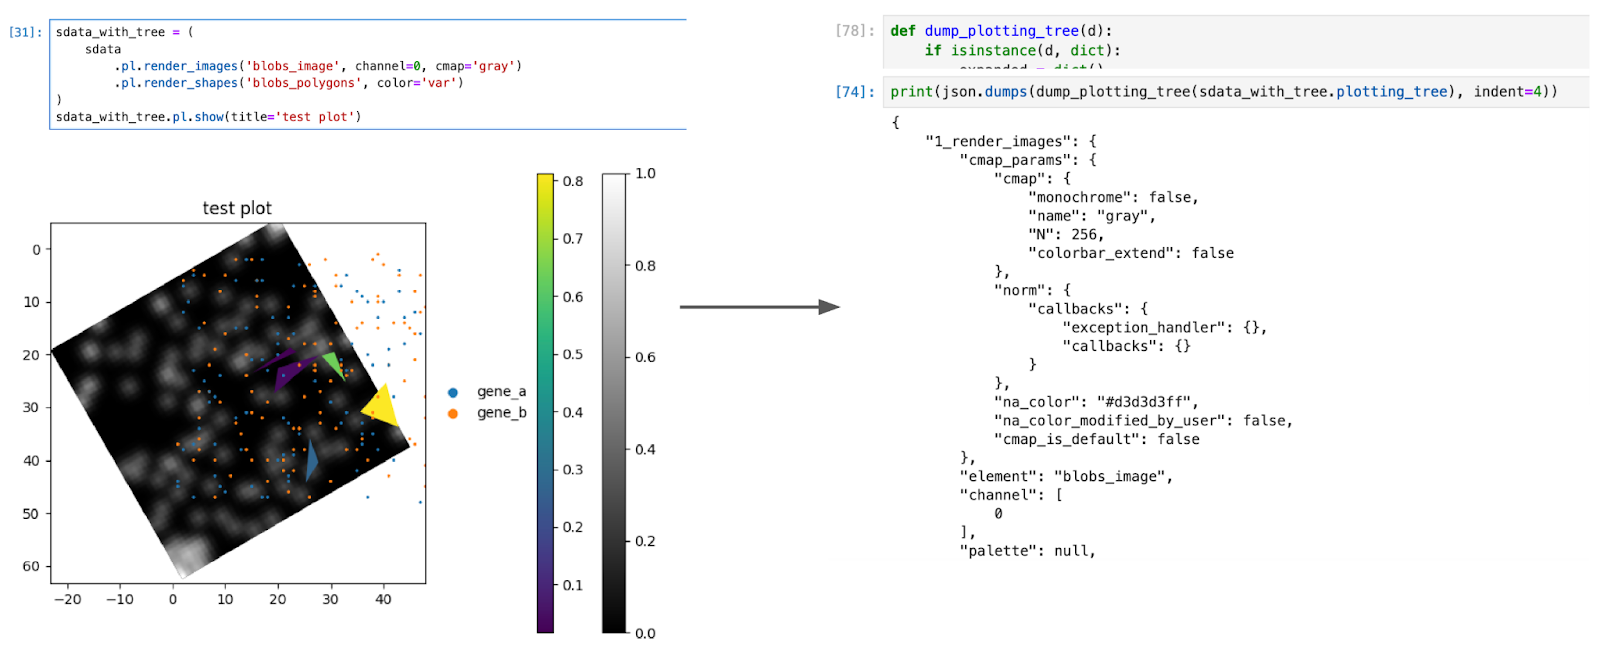
Left: the plot used for testing, combining images, shapes, points and various annotations plotted on top of them. Rig...
Left: the plot used for testing, combining images, shapes, points and various annotations plotted on top of them. Right: the serialization of the plotting tree, containing all the parameters available for reproducing the plot.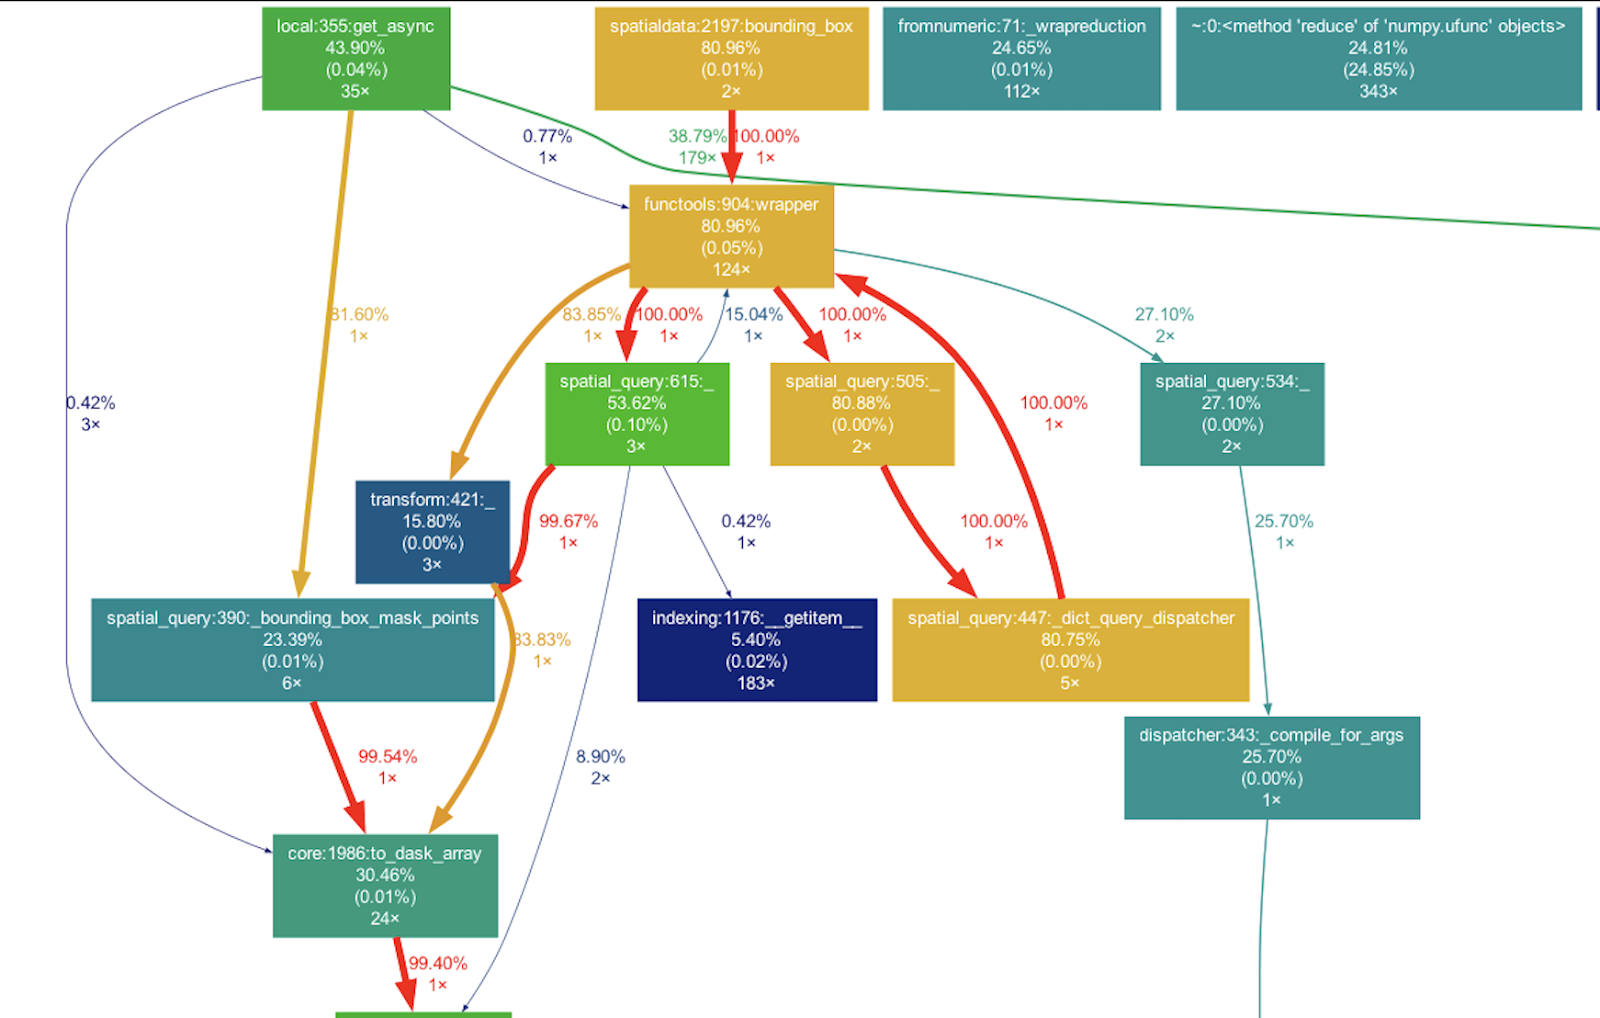
Profiling visualization obtained form gprof2dor + graphviz, used to identify the computational bottleneck for queryin...
Profiling visualization obtained form gprof2dor + graphviz, used to identify the computational bottleneck for querying points in the SpatialData framework.