Oncomatch- Optimizing Oncology Combination Therapy Prediction
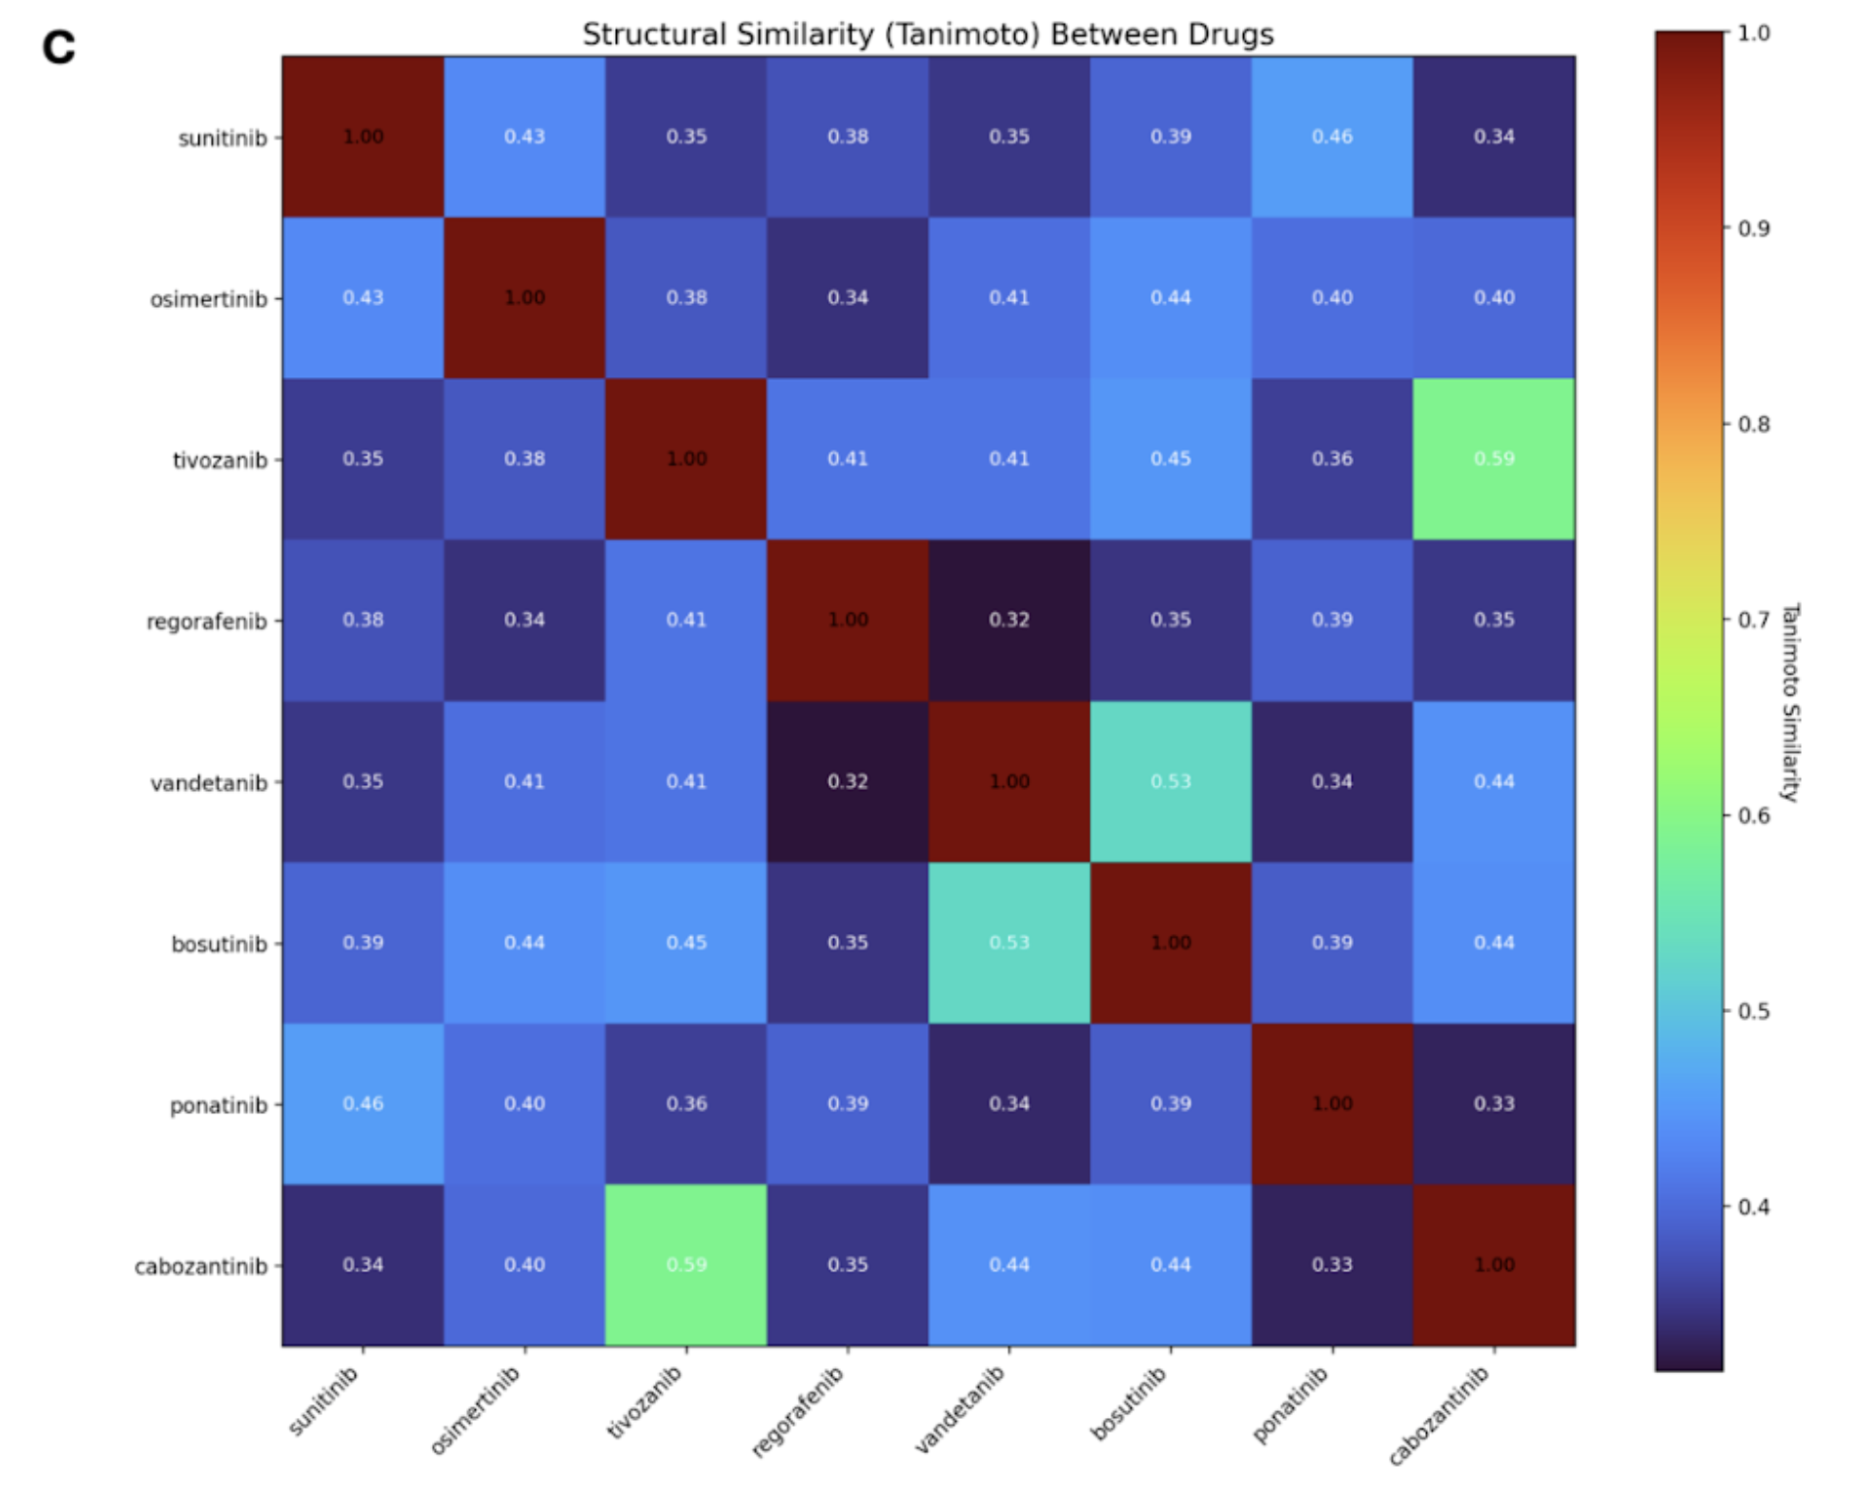
Advances in precision medicine are reshaping cancer treatment by tailoring therapies to a patient’s specific genetic profile. Despite this, matching cancer mutations to effective drugs remains a complex task due to variability in mutations across cancer types and limited tools for practical clinical application. In this project, initially developed during the BioIT Hackathon2025, we created OncoMatch—an open-data-powered web application designed to bridge thisgap by integrating genomic, transcriptomic, proteomic, and drug-target interaction data tosupport therapy selection.Building on prior work in colorectal cancer, we expanded our scope to include bladder, ovarian,and non-small cell lung cancer (NSCLC), using the COSMIC and DrugCentral databasesto identify relevant gene mutations and therapeutics. We developed two novel scoringsystems—the Cancer Precision Score (CPS) and Gene Precision Score (GPS)—to evaluatedrug specificity and potential effectiveness. Using data from DrugCentral, LINCS L1000,and DeepCoverMOA, we created a unified bioactivity dataset for over 4,000 drugs, including measures such as IC50 and Kd values.The OncoMatch platform features interactive tools to visualize drug bioactivity, assess multiomic and structural similarity among compounds, and explore potential drug combinations. Users can query drugs by cancer type and gene mutation, generating insights into the mostpromising therapies and alternatives. Our open source approach not only democratizes access to high quality bioinformatics tools but also encourages data driven, personalized cancer care. Future directions include refining subtype level predictions and improving the platform’s utility for combinatorial therapy planning. We have developed a streamlit app to make it easy to access this data. That app can be found at https://oncomatchapp-precision-medicine.streamlit.app.
Figures
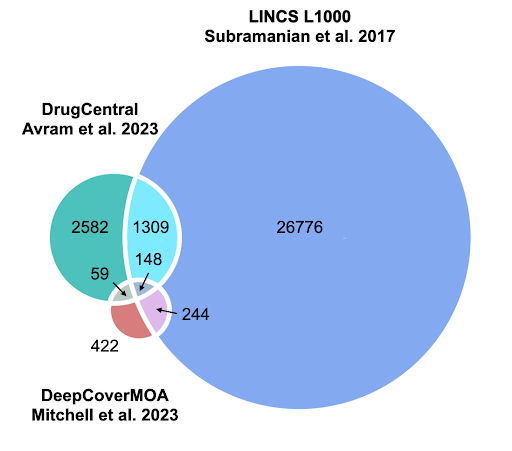
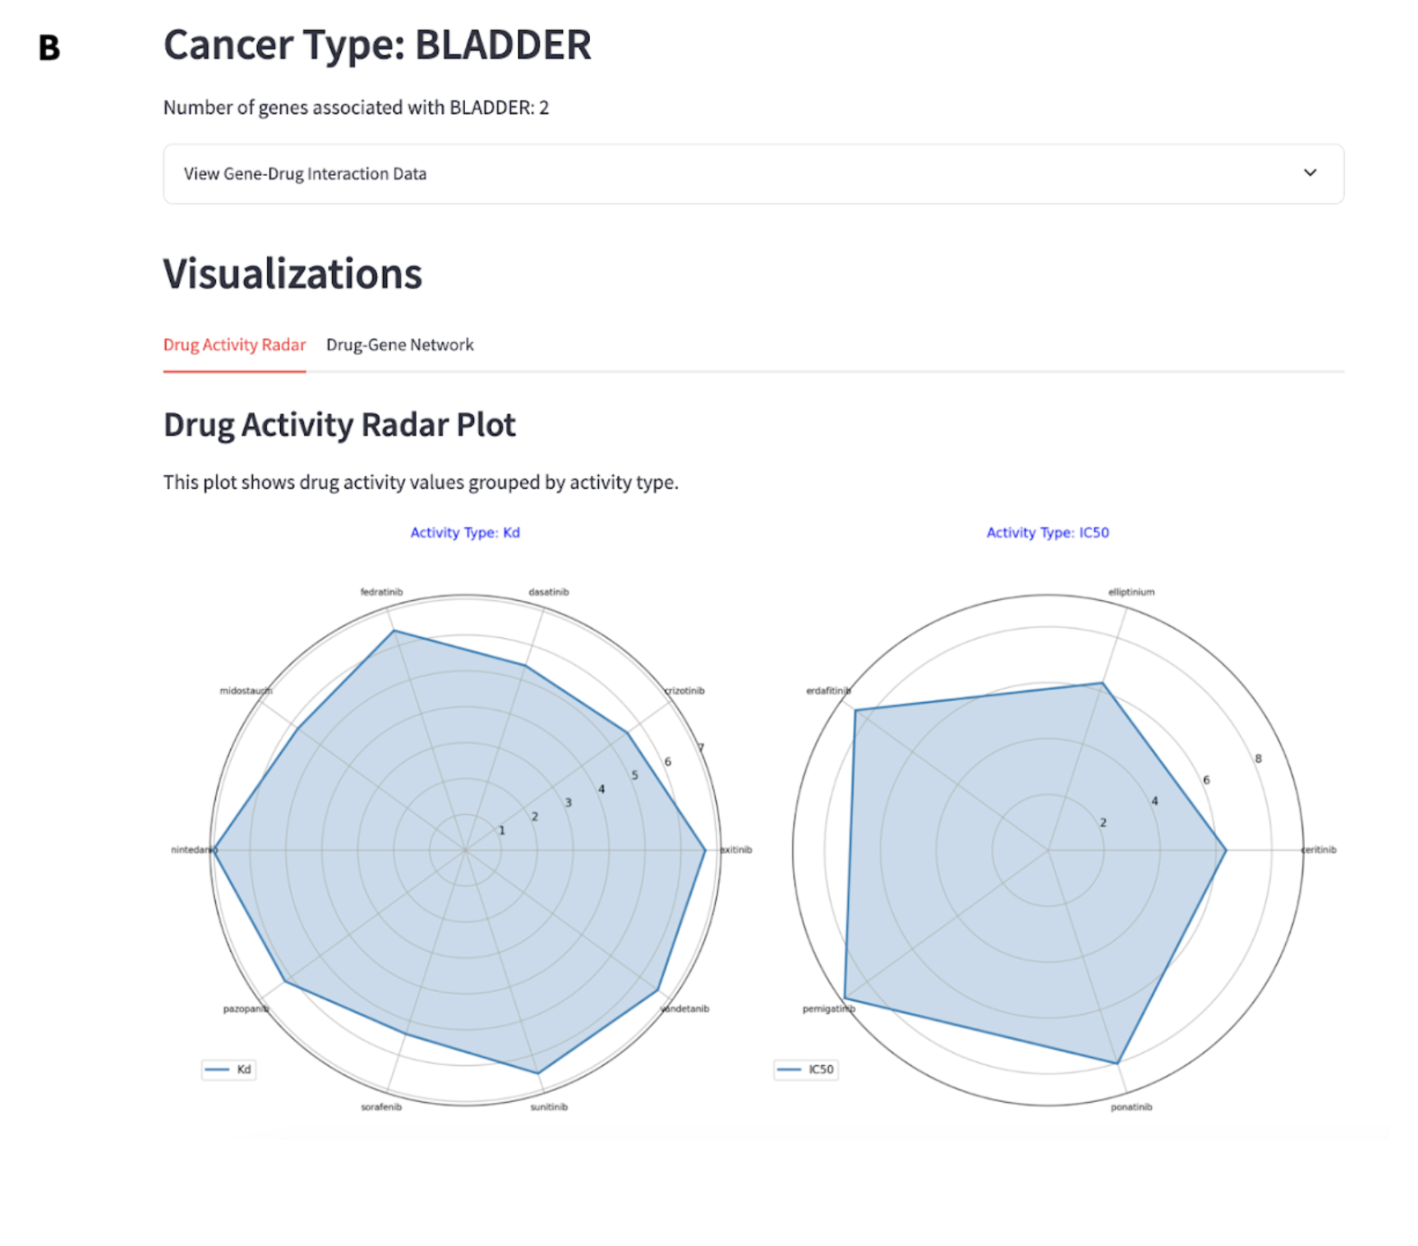
Figure 2. OncoMatch Web Application. (A) Overview of the OncoMatch workflow, including user input, backend data integ...
Figure 2. OncoMatch Web Application. (A) Overview of the OncoMatch workflow, including user input, backend data integration, and output generation. (B) Screenshot of the interactive web interface, which allows users to explore bioactivity values, specifically Kd and IC50, of genes associated with a selected cancer type.