The BioAI Hackathon at the Centre of New Technologies at the University of Warsaw convened 43 international researchers to collaboratively explore artificial intelligence (AI) approaches for solving complex challenges in computational biology. Nine interdisciplinary and multi-institutional teams addressed the following problems: disease-gene prioritization, microbiome analysis, drug-protein interactions, alternative splicing prediction, chromatin architecture study and toxicological profiling. Using cutting-edge tools such as graph neural networks (GNNs), large language models (LLMs), and multi-omics integration frameworks, participants developed scalable and reproducible analytical pipelines. The results include: a disease gene prioritization framework using GNNs, a microbiome dynamics analysis for poultry health prediction and the construction of chromatin structure-aware regulatory networks. All projects follow the open science principles and display translational potential. This hackathon underscores the transformative role of AI in biomedicine and the value of collaborative, time-bounded innovation for accelerating discovery in life sciences. All projects are publicly available on GitHub: https://github.com/SFGLab

Figures
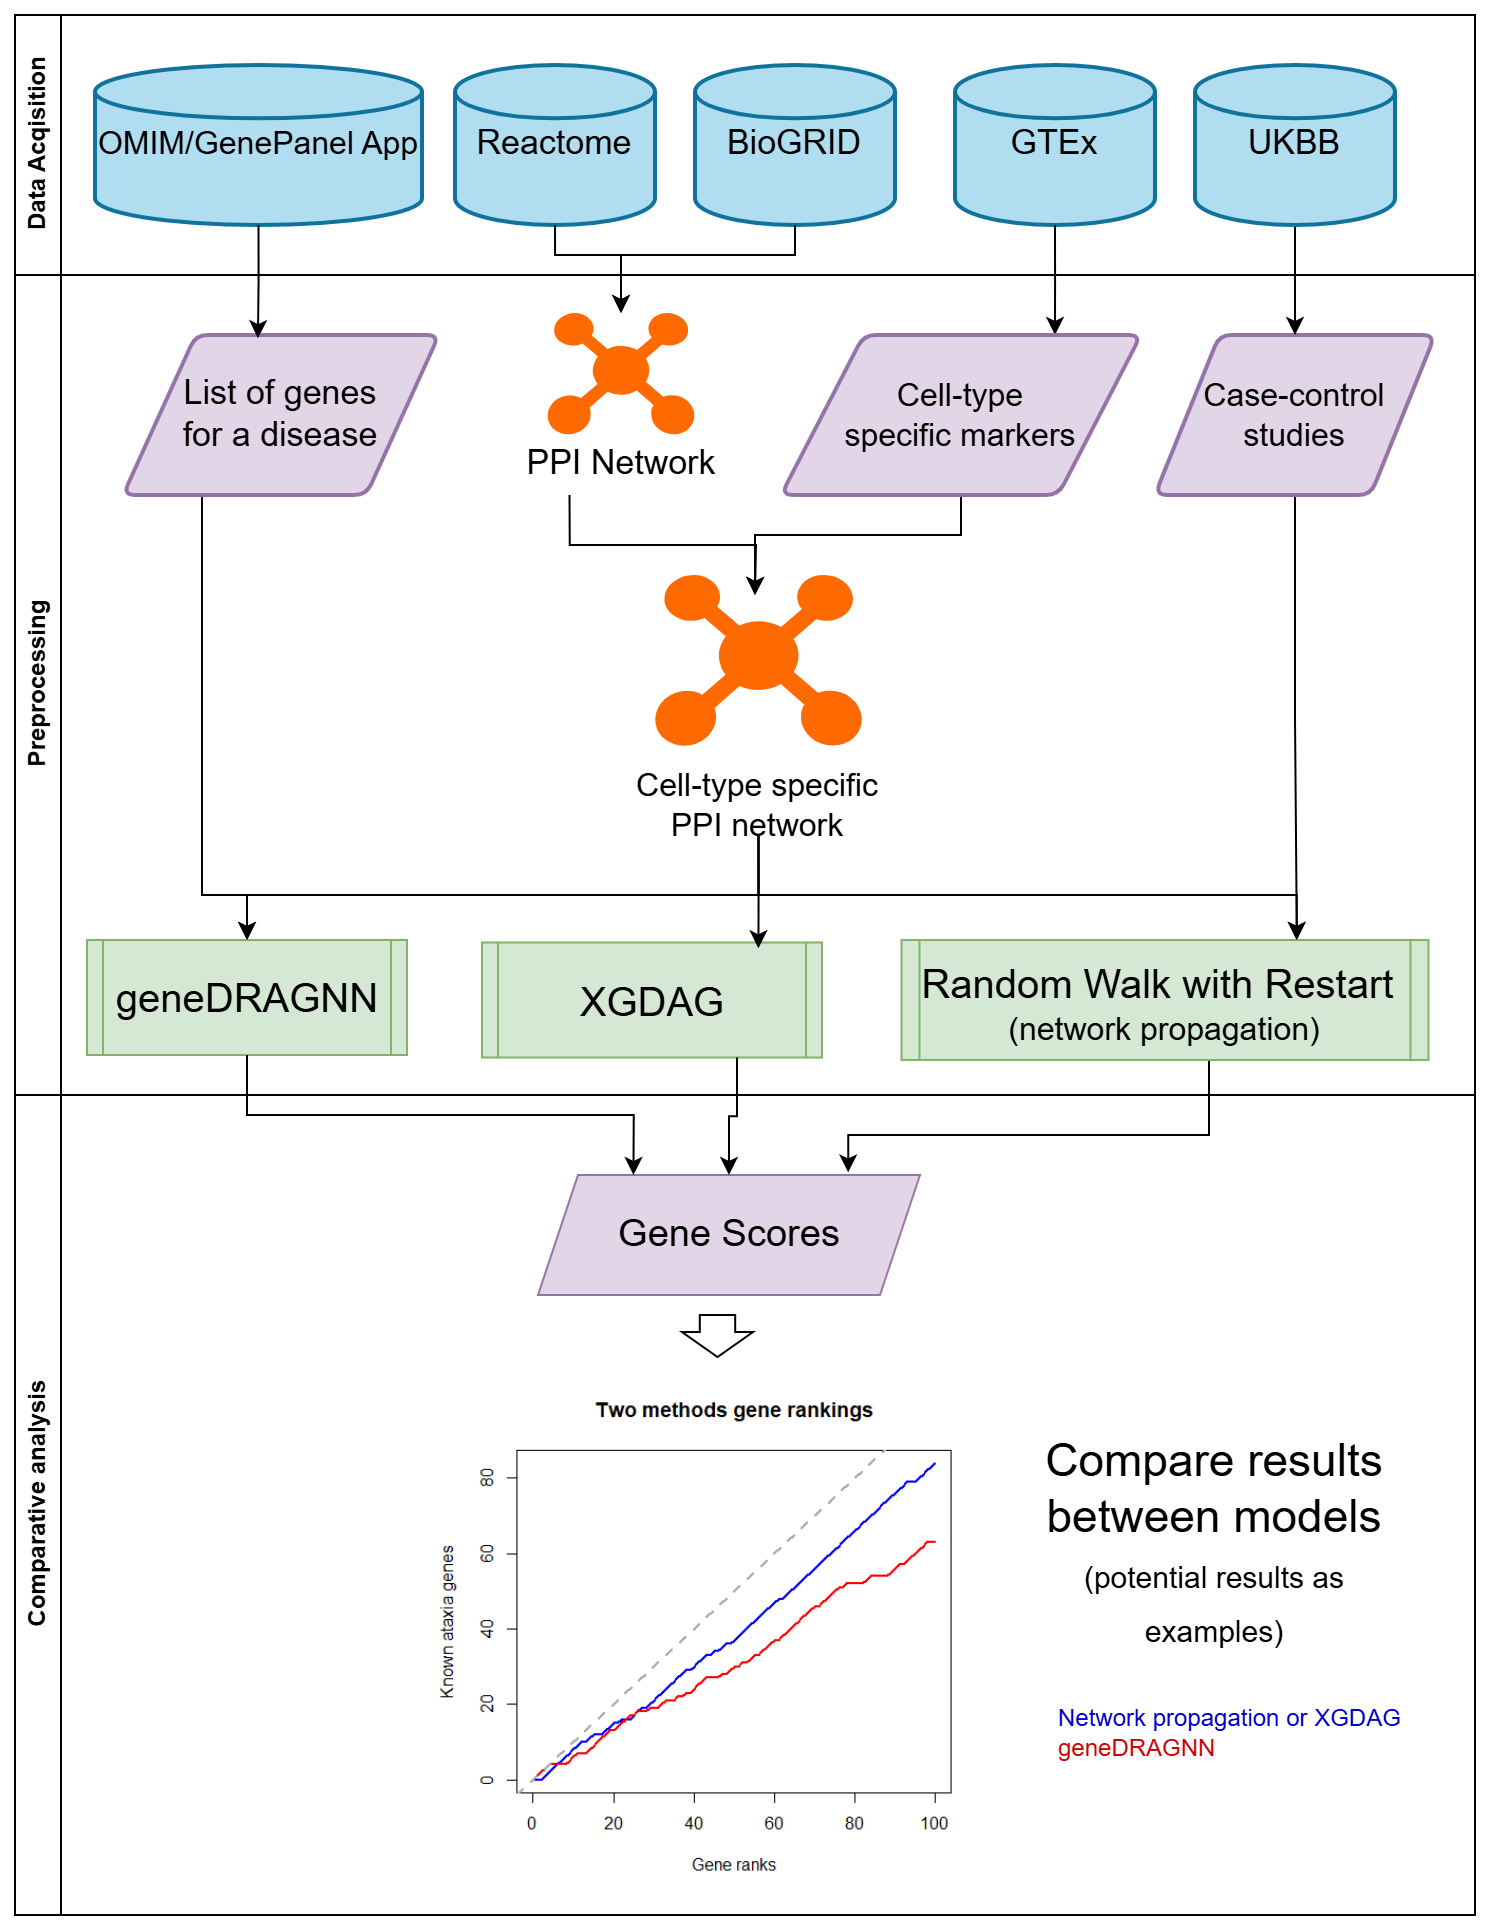
Figure Team 1-1. Overview of Team 1’s gene prioritization workflow using graph neural networks (GNNs).
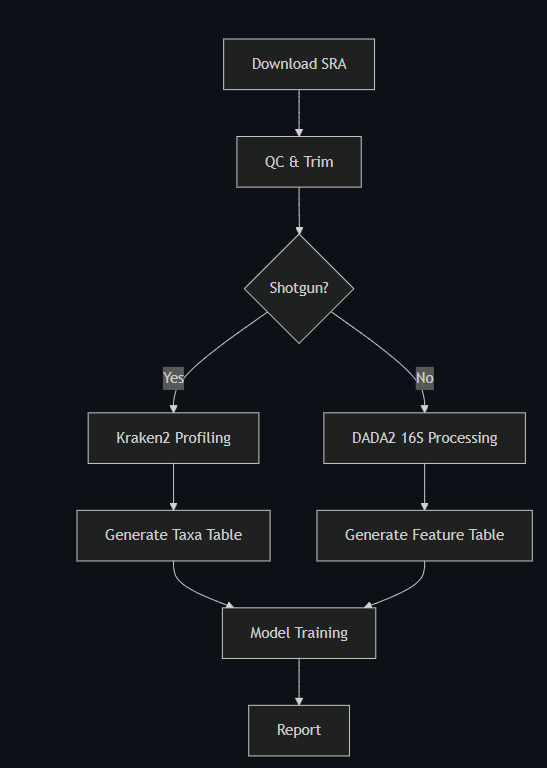
Figure Team 2-1. Overview of Team 2’s microbiome analysis pipeline integrating AI-based interpretation.).
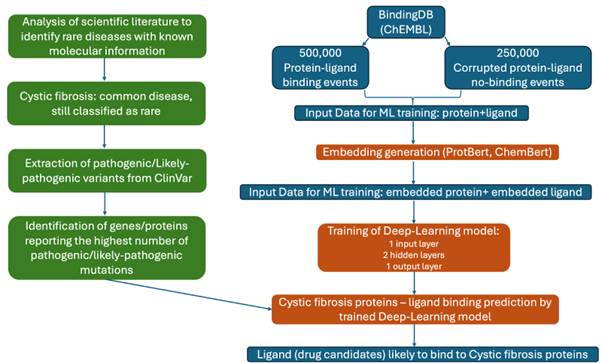
Figure Team 4-1. Overview of Team 4’s AI-driven pipeline for drug target discovery in rare diseases.
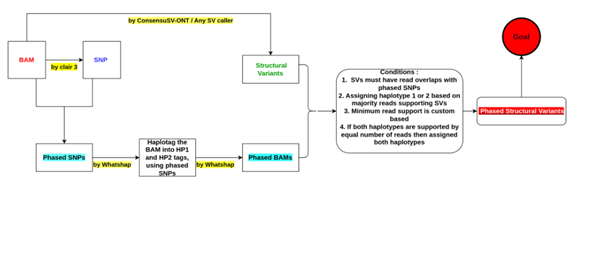
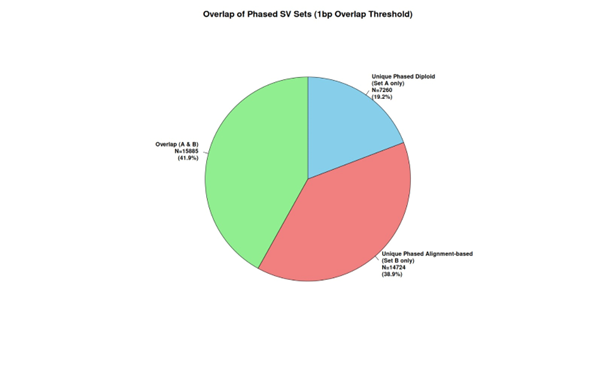
Figure Team 5-1. Overview of Team 5’s structural variant phasing pipeline, SvPhaser.
Figure Team 5-2. Data preprocessing and SV discovery module.
Figure Team 5-3. Phasing and haplotype resolution methodology.
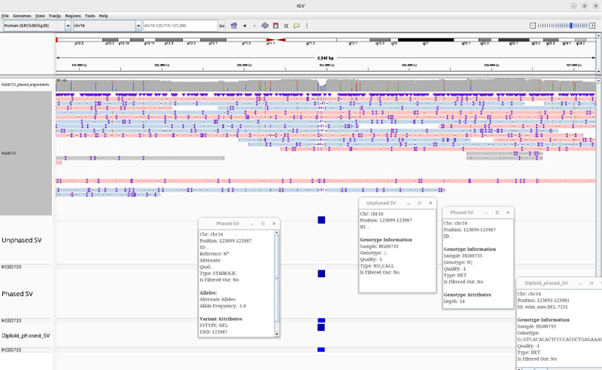
Figure Team 5-4. Visualization interface for phased SVs.
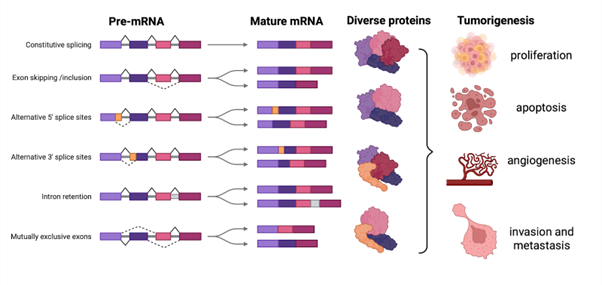
Figure Team 6-1. Introduction – Generic background to alternative splicing.
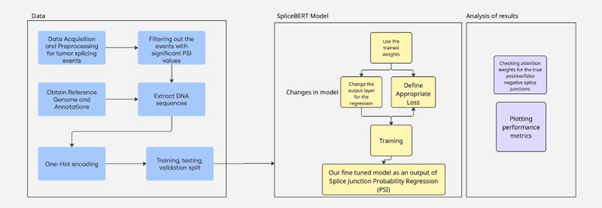
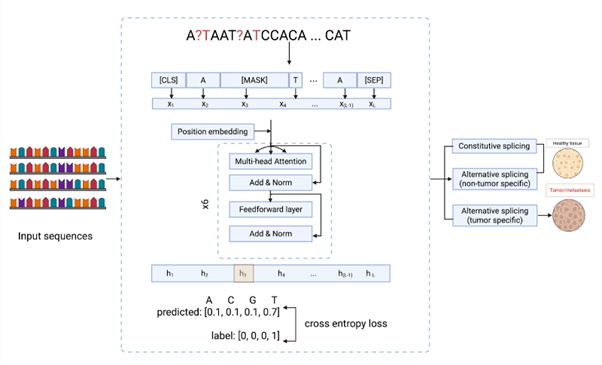
Figure Team 6-2. Methods – Overview of the methodology.
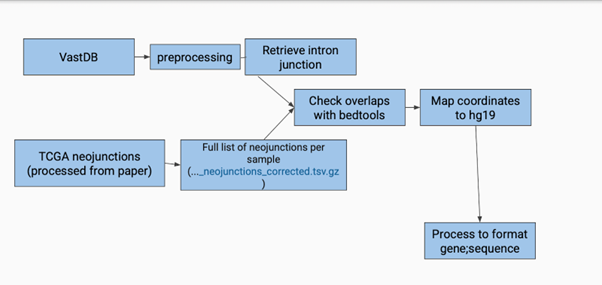
Figure Team 6-3. Methods – Overview of data processing.
Figure Team 6-4. Results – Alternative splicing model.
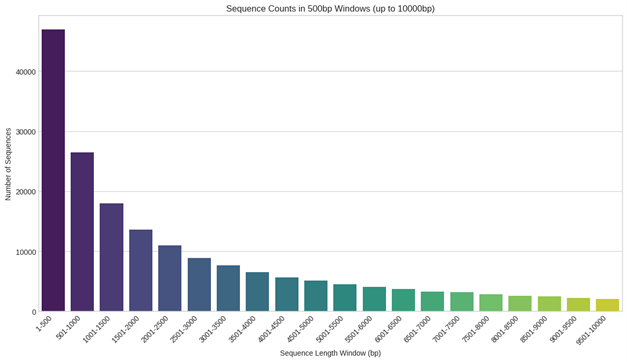
Figure Team 6-5. Results – Sequence length variation.
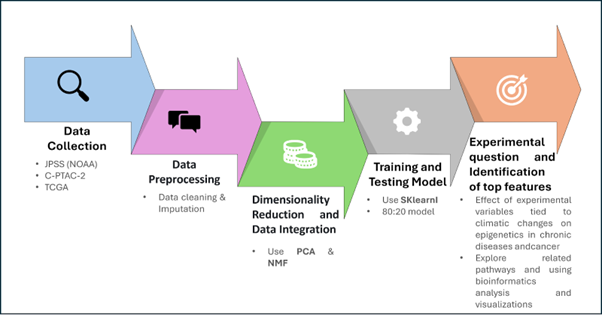
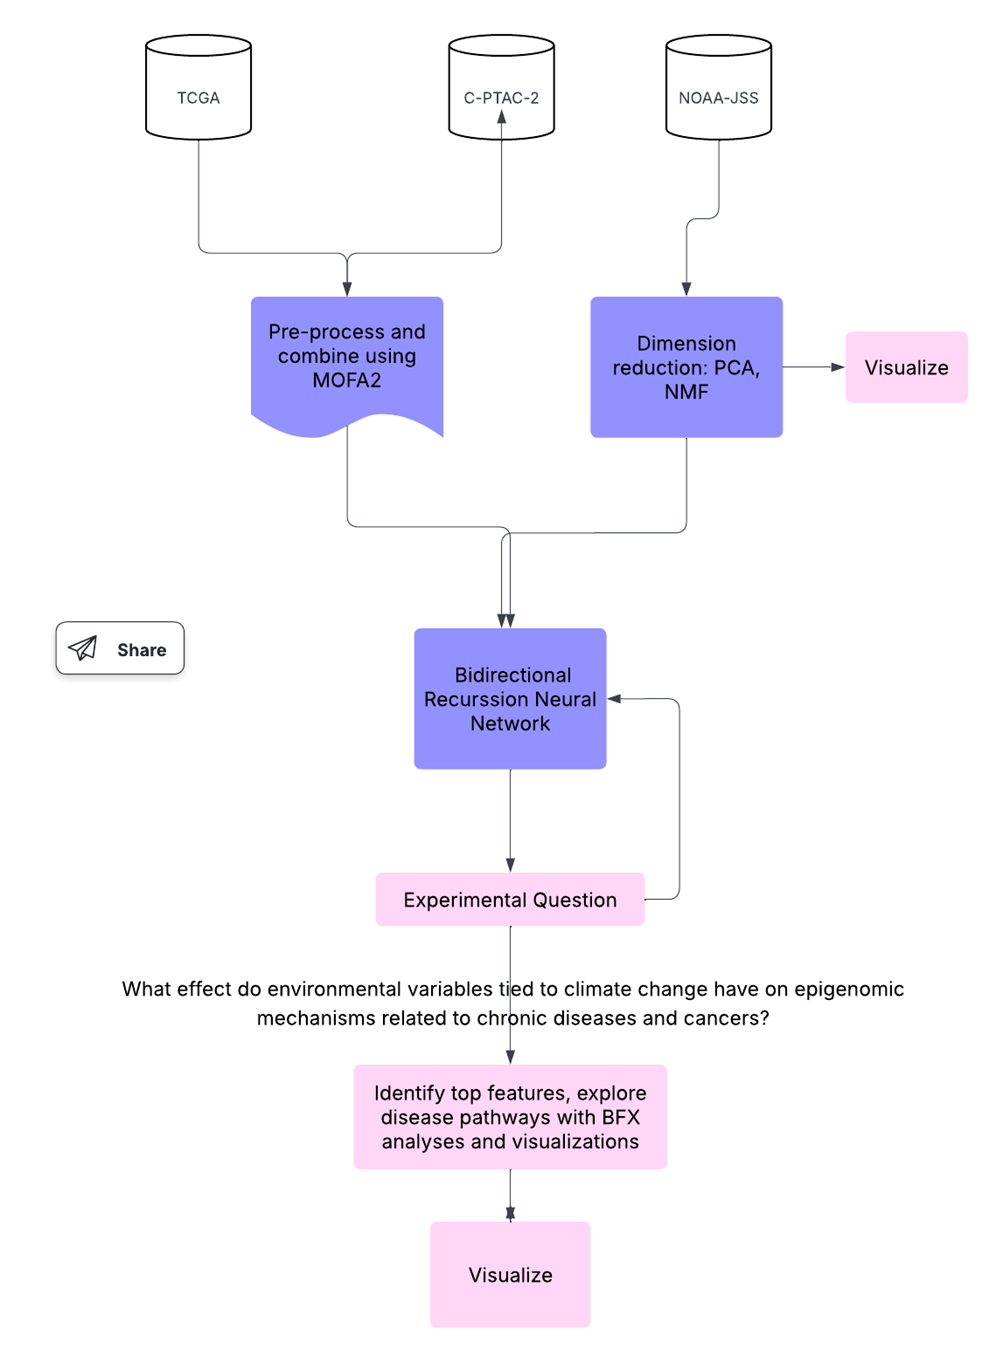
Figure Team 7-1. Overview of Team 7’s EpiXposome framework for integrating epigenomic and exposomic data.
Figure Team 7-2. Epigenomic and exposome data preprocessing.
Figure Team 7-3. Machine learning modeling and interpretation phase.
Figure Team 7-4. Visualization and biological insight reporting.
Figure Team 8-1. Overview of Team 8’s phase-specific chromatin state change workflow.
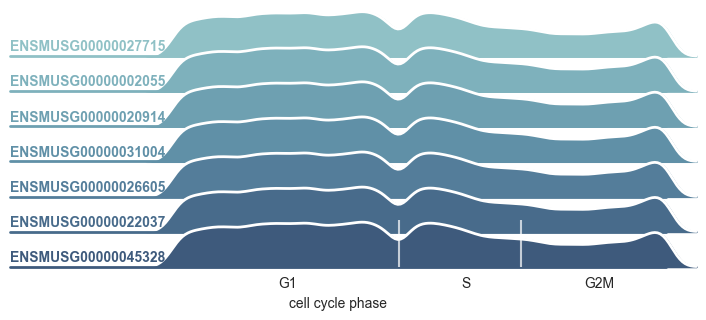
Figure Team 8-2. Gene examples illustrating expression differences across phases.
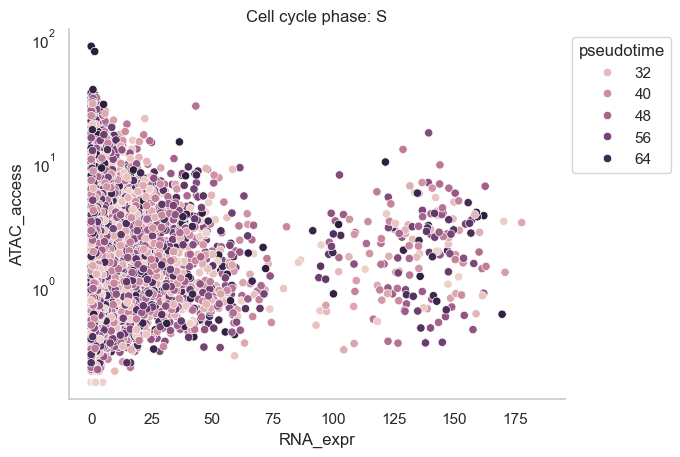
Figure Team 8-3A. Chromatin accessibility vs expression in S phase.
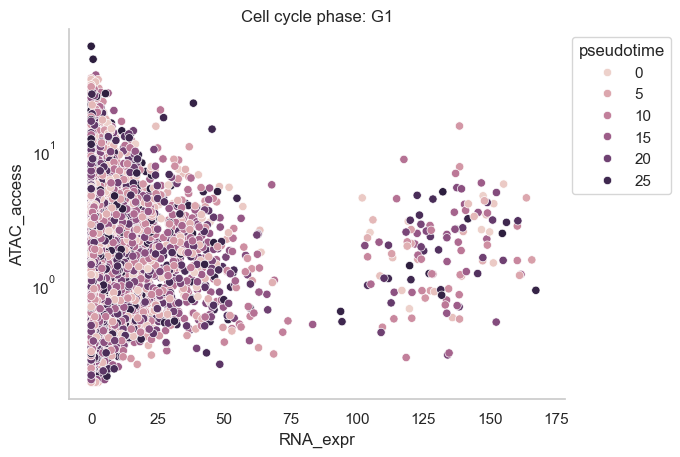
Figure Team 8-3B. Chromatin accessibility vs expression in G1 phase.
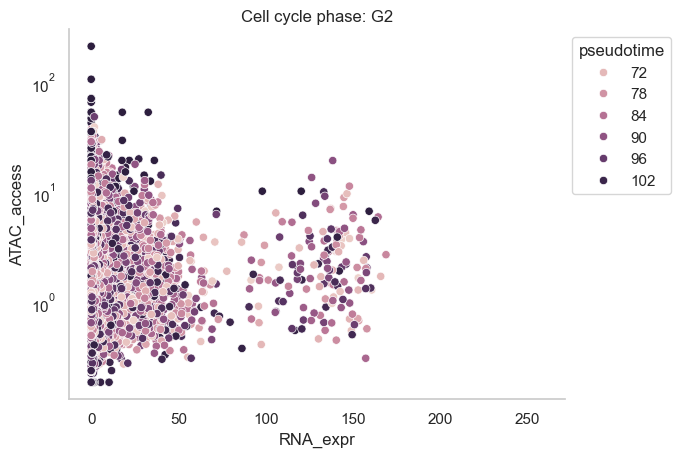
Figure Team 8-3C. Chromatin accessibility vs expression in G2 phase.
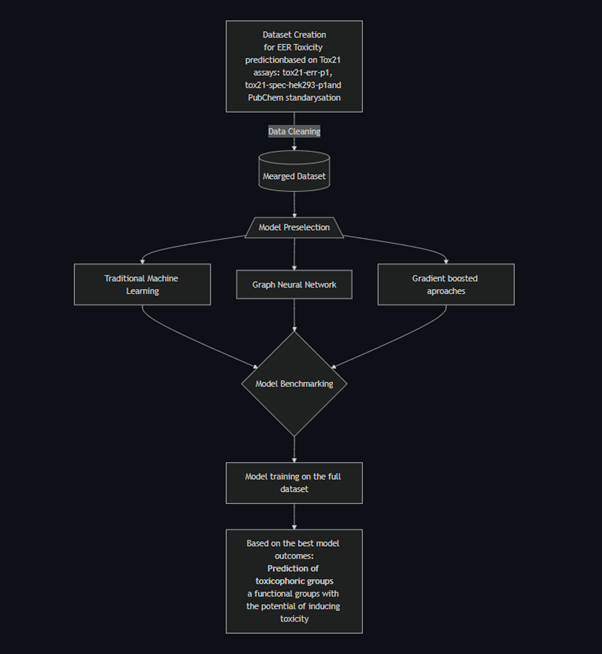
Figure Team 9-1. Overview of Team 9’s AI-powered toxicological profiling pipeline.
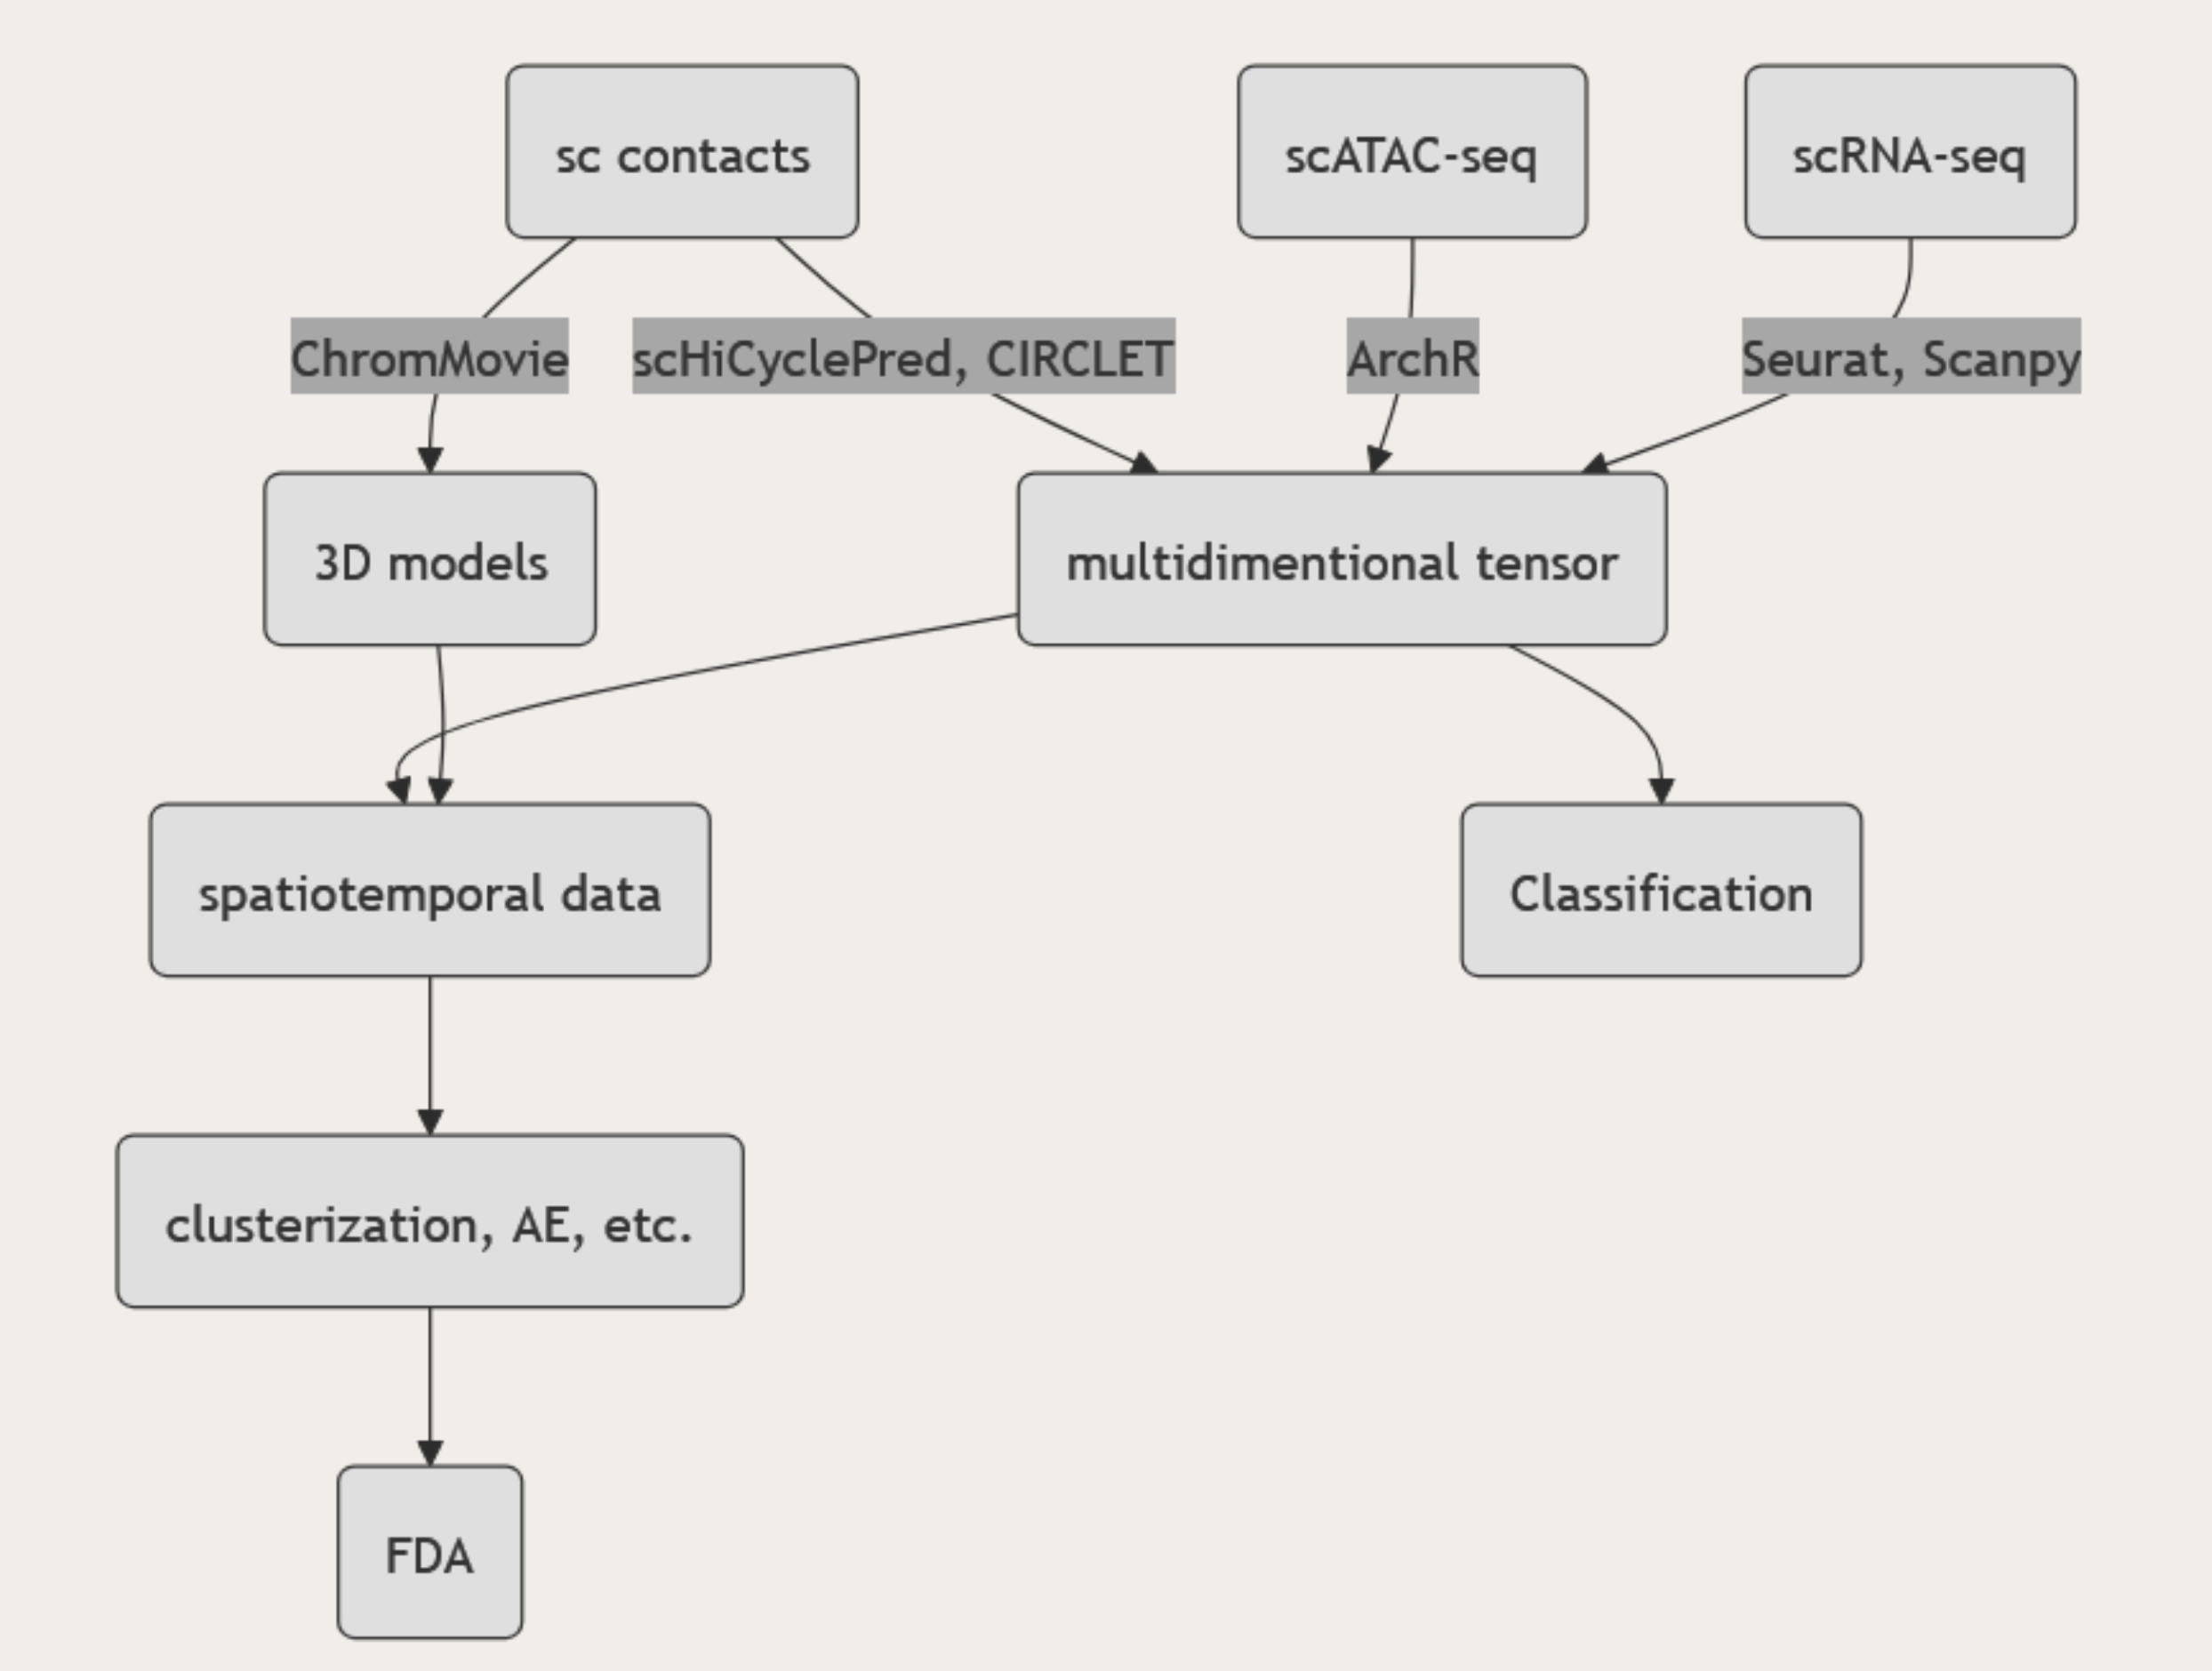
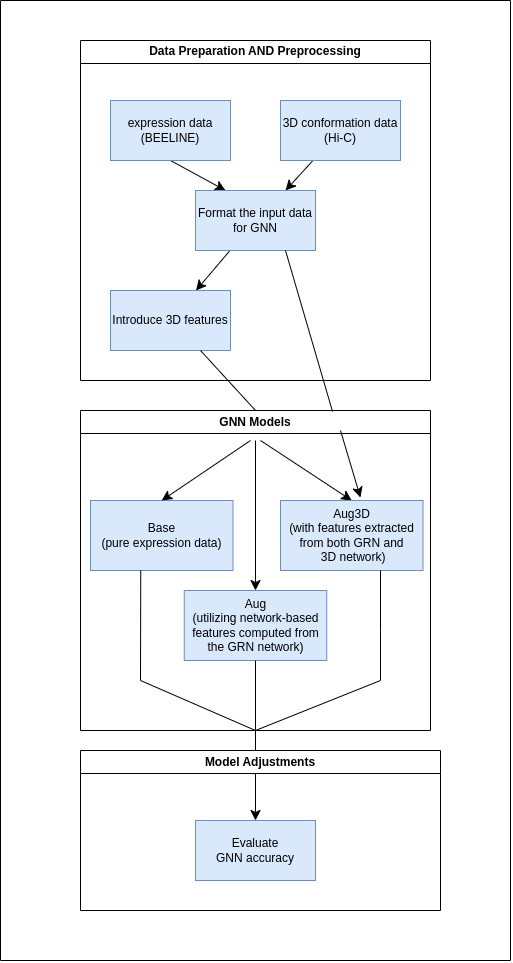
Figure Team 10-1. Workflow of Team 10’s 3D gene regulatory network inference using GNN.
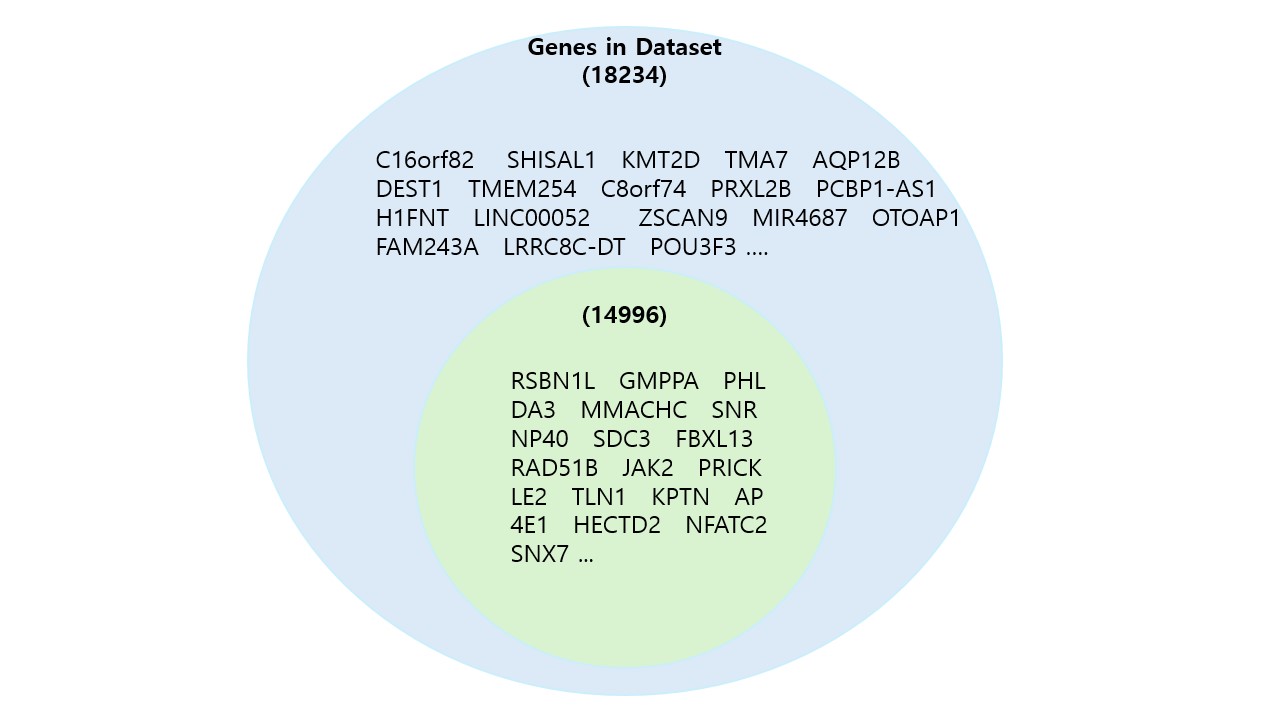
Figure Team 10-2. Comparative visualization of data inputs across multiple configurations.